 About Shop.com
We will see in this case study how shop.com, an e-commerce website in the United States of America shifted from the Adobe SiteCatalyst web analytics tool to Google Analytics. shop.com is a leading on- line shopping website and offers a wide range of products and brands for purchasing. Its value propositions are savings for the customer by offers such as free delivery, cashbacks etc.
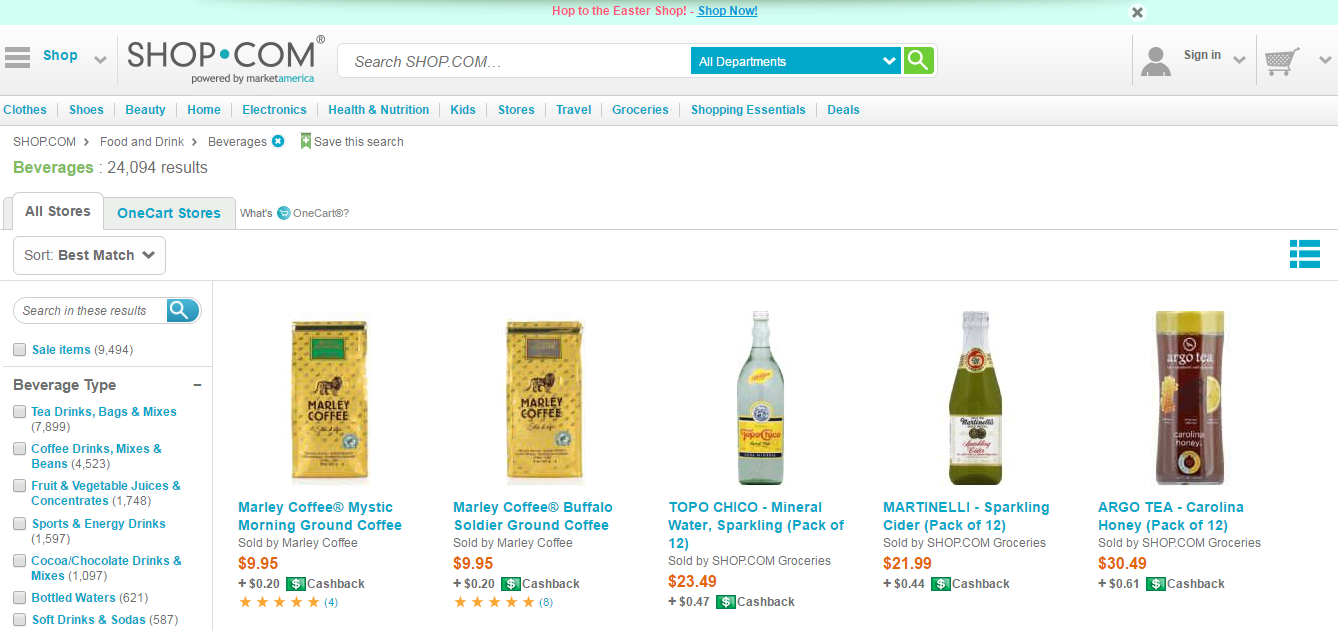
Due to the lakhs of products from thousands of brands being offered on shop.com, it is very important for them to have a reliable web analytics solution to measure the performance of the products and the website.
Objectives
shop.com were using some in- house developed web analytics tools and also a branded web analytics software- The Adobe SiteCatalyst. The challenges they faced with these were:
- Complexity of the in- house developed tools.
- High cost of maintenance of these softwares.
- High cost of training.
- Poor quality of reporting.
- Limited visibility into Paid Search traffic sources
shop.com decided to implement Google Analytics as the analytical tool for their website. They needed an experienced consultant to steer this transition from SiteCatalyst to Google Analytics. Further, they found out that the standard Google Analytics reporting and goal conversions were not adequate for shop.com’s analysis needs. A highly customised implementation of Google Analytics was required.
Shop.com engaged Blast Advanced Media( Blastam), a Google Analytics certified partner, to implement this project. Blastam worked with the shop.com team to understand their business objectives and analysis requirements.
With shop.com’s extensive product range and traffic, the number of pageviews were so large, that the basic Google Analytics implementation would not have been able to handle this volume. They also wanted to gain insights into the internal site search and product and category performance. Blastam worked to develop a custom tracking strategy that would give an insight into all the analysis requirements of shop.com and also give an easy reporting solution.
Approach
Blastam utilised the advanced features in Google Analytics to implement this project. We will see how some of these features helped Blastam to achieve shop.com’s objectives.
Site search
This feature gives details about the search behavior of visitors once they have entered the website.
Site search metrics are:
- Sessions with search: The number of sessions that used the website’s search function at least one time
- % of sessions that used internal search: Sessions with search/ Total sessions
- Total unique searches: Total number of times website’s search was used excluding multiple searches on the same keyword in the same session
- Results pageviews/ Search: Number of Pageviews of search result pages/ Total unique searches
- Search Exits: The sum of searches made just prior to leaving the website
- Percentage of Search Exits: Search Exits/ Total unique searches
- Search refinements: The number of times a user searched again just after performing a search
- Percentage search refinements: The percentage of searches that resulted in search refinements ie. Search refinements/ Pageviews of search result pages
- Time after search
- Search depth
Site Search dimensions are:
- Search Page: Page on site where the user enters the search terms
- Search Results Page: Results page that is turned up after the search engine query
- Results Pageview: The page that is viewed after clicking on the Search results page
- Goal Conversions: Goal conversions in site search are calculated where at least one search is done on the website.
Insights that are obtained from Site search:
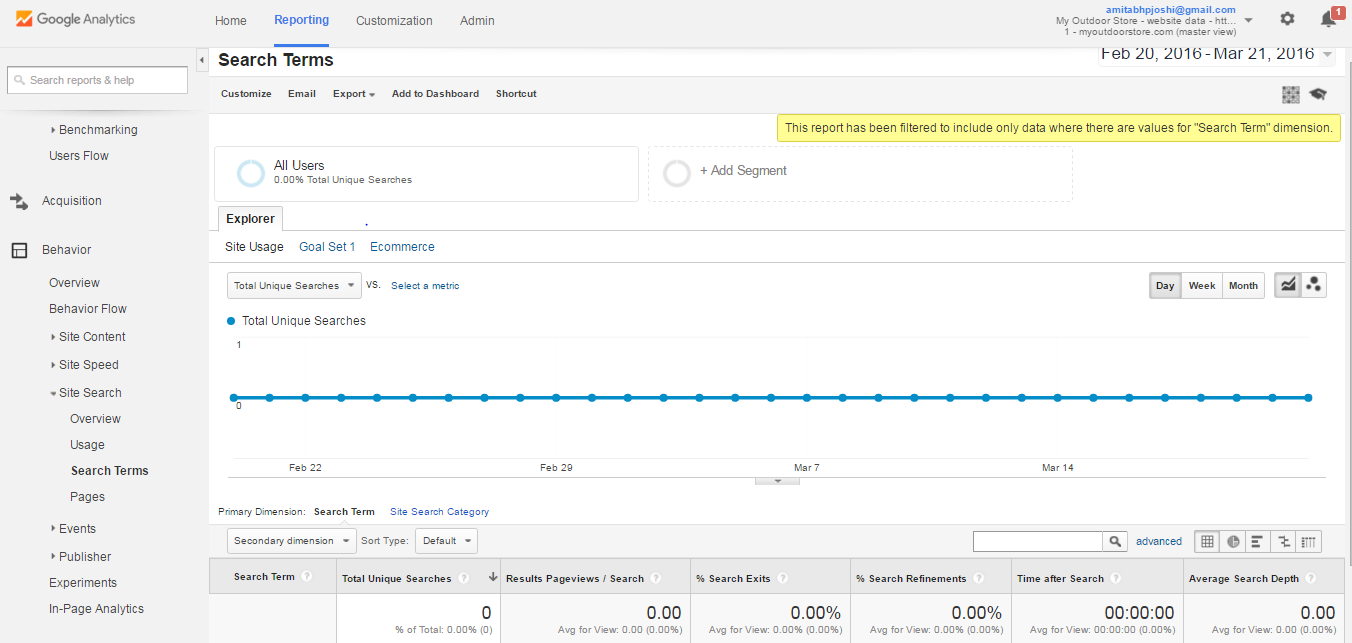
- How often do users use the search box in the website and what are they looking for?
To find out what the users were looking for, use the path Behaviour—à Site Search—àSearch Terms
This report will give ‘Search term’ wise report. See picture below.
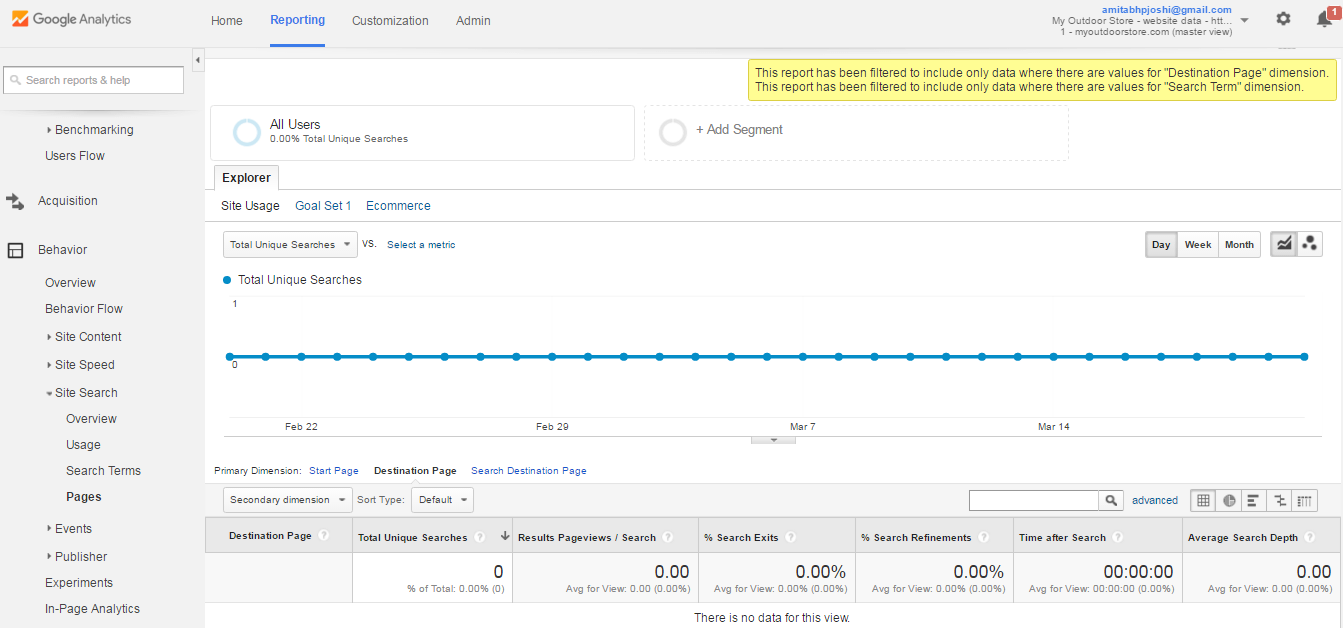
- Where do the users begin their search and where do they land up after searching?
To identify the pages from where the users started their searches, the path is Behaviour–àSite Search–àPages.
Once users have started search on the website and have been provided the search results, to find out which pages they are likely to see, change the primary dimension in the above report to Destination report. You will get the report of the destinations of the users after they have got the search results. See the picture below.
- Are users satisfied with what they find?
The % Search Exits metrics is a good indicator of how good the search results are? If users wander away from the website after the search results appear instead of clicking on any of the results, this indicates that the search engine does not throw appropriate results for the user. In this case, you have to fine tune your search results to provide relevant results for the user.
Another related metrics is Results Pageviews/Search which gives the ratio of the number of pageviews as a percentage of total searches. More this number implies more relevant are the search results.
- How different groups of users search the site?
By applying segments, this search behavior of different groups of users can be studied.
- What are the business outcomes due to user searches on the website?
Are there business benefits of providing the search box? Does having a search box results in higher conversions or revenue? The Goal and e- commerce tabs provide information about these searches.
Thus Google Analytics gives an in- depth insight on the search behavior of visitors on the website.
E-Commerce Tracking
The e- commerce reports allow to track purchase data from a website. A separate snippet of code has to be tagged into the e- commerce pages like shopping carts. Also e-commerce reports have to be activated. This will generate very useful e- commerce reports.
E- commerce data comprises of transaction and item data. Transaction data comprises of affiliation( ie the store from where the transaction was connected) , revenue, shipping and tax data. An item denotes an individual item that was purchased during a transaction. It includes Name, Stock Keeping Unit( SKU), Category, Price and Quantity.
Standard E-commerce reports
- Overview: This includes summary of revenue, e-commerce conversion rate, transactions, Averagee Order values and other metrics
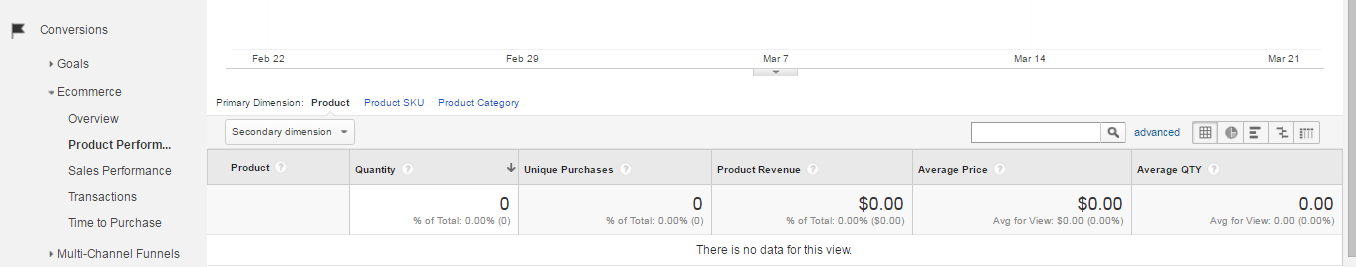
- Product Performance: This includes product wise revenue, Purchases, Quantity, Average Price, Average Price by SKU and category
- Sales Performance: Revenue by date
- Transactions: Revenue, Tax, shipping and quantity per transaction id
- Time to purchase: Days to transactions and sessions to transactions

Some of the insights you can get from e- commerce reports are:
- Which Products are selling more?
- What is the Revenue per transaction. This can help you determine quantity discounts to increase average revenue per transaction
- How long( in terms of number of sessions and days) do customers take to buy your products? If the cycle is stable and does not fluctuate much, it can give you predictable conversion times which can help you in forecasting and procurement. If the cycles are varying and abnormally long, it may point to the improvements required in the website design.
Enhanced E- commerce
Enhanced e- commerce digs further deep into the purchasing process and give following information:
- Shopping and Purchasing behaviour: The shopping analysis reports give shopping behaviour of users- product pageviews, adding and removing products from shopping carts, started, abandoned and completed transactions
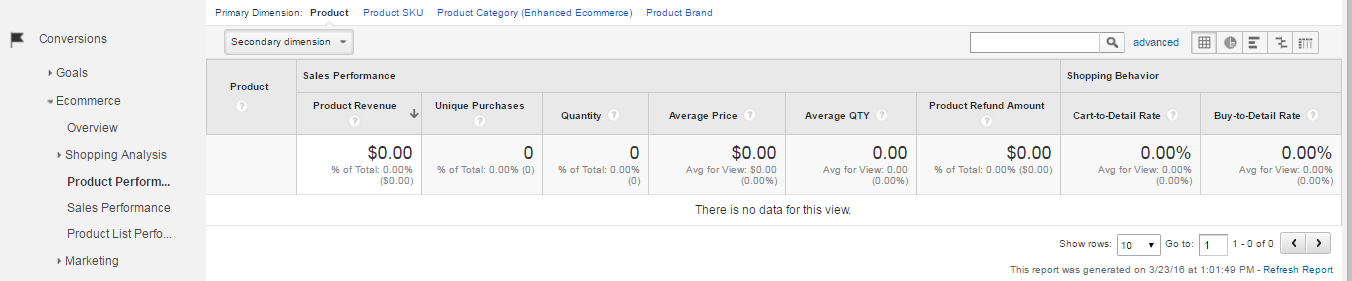
- Economic performance: The overview and product performance reports give the revenue and conversion rates for products, number of products per transaction, average order value, rate at which users add products to carts and make purchases after having viewed product pages, number of refunds issued etc.
- Merchandising success: These help in tracking the effectiveness of internal and external marketing efforts to promote products. The affiliate Code report helps in tracking revenue, transaction and average order value of the associates affiliate sites that drive traffic to your websites. The same metrics can be tracked in the Order coupon report for the order level coupons. the Product coupon report informs you about how effective product coupons are in terms of revenue, unique purchases and product revenue per purchase. If you are using internal promotions such as a promotional banner in your website promoting a product in another part of your website, you can track views, clicks and click through rates for these promotions in the internal promotion report. You can also track the effectiveness in product lists in product movements.
- Product attribution: In enhanced e- commerce, the product list performance report give attribution of events such as add to cart, check out or purchase to the last product list the user interacted with prior to conversion. This helps in tracking the effectiveness of product lists.
Thus we find that enhanced e- commerce tagging gives extremely deep insights into the purchasing process and values.
Integrating multiple Google AdWords accounts with Google Analytics
Google Analytics can easily link with Google AdWords. This gives a seamless visibility from ad impressions, clicks to behaviour and conversions in the website. Based upon this rich mine of data, the AdWords campaigns can be fine- tuned for improved clicks and conversions.
Results
- Shop.com got access to a variety of detailed reports discussed above after implementing Google Analytics for free
- Since Google Analytics is a cloud based product, the cost of maintenance is zero. Also all upgrades are free.
- shop.com got a visibility into AdWords traffic sources
- Profiles with different views were created for different groups of employees
- Due to a standard and intuitive interface across the organisation, training costs were reduced.
Learnings
Google Analytics is a benchmark product offering a wide range of standard web analytics features free of cost. It is quite easy to use too.
Image courtesies:
- shop.com
- Google Analytics