
The most common question after how I can optimize my site’s online presence that advertisers and SEOers want to know is What is Google Analytics and how it can help them in measuring their site’s performance.
Google Analytics is actually a service that is available to anyone with a Google account and some of its notable services are-
- Data visualization tools such as dashboard, motion charts scorecards that help you see the display changes in data over time
- Custom reports to analyze the performance of optimization and advertising campaigns
- Email-based sharing and communication of different reports
- Immaculate integration with other Google products like AdWords, Website Optimizer, Public Data Explorer, etc.
Exploring this post will help you comprehend what is Google Analytics in the most in-depth way possible, and therefore, without any further delay, let us directly delve into this 5-Step Google Analytics Guide-
5 Steps to Learn Google Analytics
1. What is Google Analytics?
- Google Analytics can be understood as a free service that helps advertisers and marketers find comprehensive statistics regarding the behavior of the visitors to their sites.
- Different kind of data that you can get via Google Analytics consists of site visits, bounce rate, page views, pages per visit, average time on site, percentage of new visits, etc.
- Google Analytics is mainly geared towards small and medium-sized sites because the service has some sorts of limitations, which impede its efficiency while handling analytics of more complex websites and larger enterprises. Google analytics collects data via a JavaScript page tag inserted in the code of pages you wish to collect data on and this page tag works as a Web bug for gathering the visitor information. However, because this page tag is reliant on cookies, you cannot collect data for users who have disabled the cookies.
- Along with all this, Google Analytics also helps advertisers track referral traffic including search engine, website referrals, direct visits, and marketing campaigns such as email marketing, banner advertising, PPC Advertising, etc.
- After understanding what is Google Analytics in this section, the next section will help you know about different things that advertisers do by using Google Analytics
2. What are the awesome things you can do with Google Analytics?
- Google Analytics helps you see your most important analytics data first
- As discussed in last section of this What is Google Analytics guide, you can use Google Analytics to find out which online campaigns bring the most traffic and conversions, plus, can determine where your best visitors are located
- When you learn Google Analytics then you can easily comprehend what visitors are searching for on your website
- You can visualize what people click on the most, uncover your top content, identify your worst performing pages, determine where people abandon the shopping cart and can discover if you need a mobile site or not
- Later in this What is Google Analytics post I will describe those data that will help you do these awesome things, but first, let us understand how you can set your Google Analytics Account
3. How can you set up a Google Analytics Account?
Setting up a Google Analytics account is quite straightforward. Below given instructions and related images are going to be the best part of this What is Google Analytics Guide to help you go through the whole process and access your traffic data-
- You need to visit Google Analytics website at google.com/analytics.
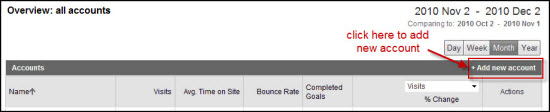
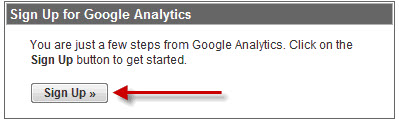
- Now, by clicking on “Add a new account” button in the upper right corner you can find the “Sign Up” button on the lower left corner of the page
- You need to fill out the asked information i.e. site URL, time zone or territory, account name, etc. Once you do this, you can click on “Continue” button
- Now, you should read all the Google Analytics Terms of Service and then check the “yes, I agree to TOS” box
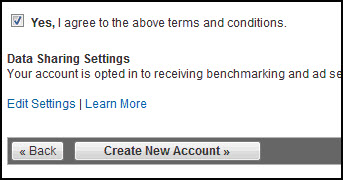
- By clicking on ‘Create New Account’ you can finish the registration
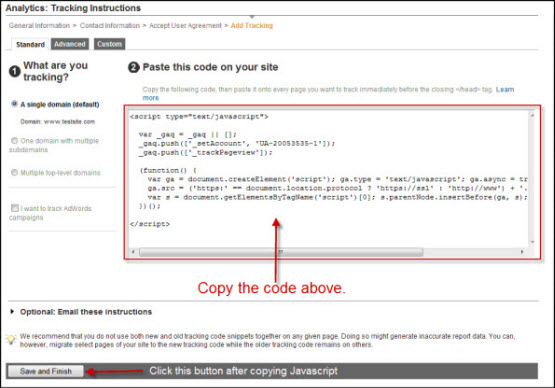
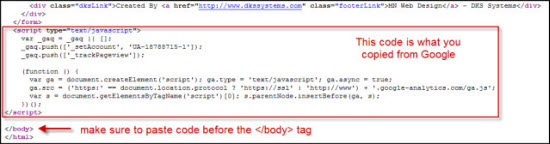
- On the following page, you will get Java Script Code that you need to copy and then you need to click “Save and Finish”
- Once you click “Save and Finish” you will be directed to the account overview. Here you will see tracking error which is there because you have not pasted the code you just copied
![]()
- When you visit a site and Google doesn’t find the cookie they report your visit as a ‘new visit’ within Analytics
- So, now in this step, you need to paste Google Analytics JavaScript code right before the body tag (within the code) for every page in your website
- Finally, you have accurately created and implemented your Google Analytics account. Wait for at least one day and then re-visit your Google accounts to see your analytics data
- Now, after letting you understand how to set up Google Analytics, this what is Google Analytics guide would tell you about the key sites data in Google Analytics in the next section
4. What are the Key Sites-Data in Google Analytics?
You are well aware of what is Google Analytics now, so the next thing that you need to learn via this what is Google Analytics guide is how to use Google Analytics. This you can do by knowing the key sites data in Google Analytics. Once you set up your Google Analytics account, it is right time to look at different sites data. Below given is the list of data available to you in your Google Analytics Report Tool-
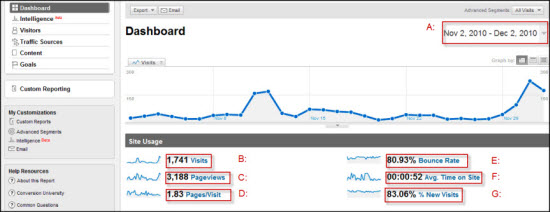
Google Analytics Dashboard Date (A)-
- You can click on the arrow next to the date you want to see the data for
- The default setting displays one months’ data but if needed, you can change it to incorporate the data of several months or even of a single day
Visits (B)-
- This lets you know how many times a user has visited your website in a fixed duration
- Whether a visitor entered to your site via homepage or any internal page, it will be counted as a ‘visit’
Pages/Visit (C)-
- This lets you know average number of pages a single visitor views before leaving the website
- However, you should know that this is just an average, there can be visitors who view more pages while some view less pages
Bounce Rate in Google Analytics (E)-
- This lets you know the people who visit your site but leave the page once he/she visits one page
- Bounce Rate = total number of visitors only viewing one page / total number of visits
Avg. Time on Site (F)-
- The average time that your site visitors spend on your website
Percentage New Visitors (G)-
- A new visitor is the one who visits your website for the very first time
- When you visit any website then Google places a unique ‘cookie’ within your browser that gets counted in % New Visitors
5. What are the different categories of Data Google Analytics provides?
By clicking on some of the left hand navigation links, you can find out four categories of data that Google Analytics offers you. These categories include different Google web analytics tools and let us delve into those three categories-
1. Visitors
2. Traffic Sources
3. Content
4. The Goals
Let us walk through these categories and learn how you can utilize the data available to you-
1. The Visitors Tab
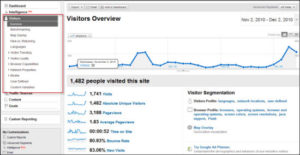
In the visitors tab, you can find out more details regarding new vs returning visitors, trending, languages, loyalty, network properties, browser capability and mobile data. This includes so many free google analytics reporting tools and subsets of data that you will find within the Visitors tab are-
Benchmarking
It lets you know how your sites’ analytics compare to other sites in same industry
Map Overlay
It helps you know where your site visitors are coming from
New vs. Returning
Language
It lets you understand whether you should have a multilingual website
Visitor Trending
Different kinds of Visitor trending information are-
- Visits
- Absolute Unique Visitors
- Pageviews
- Average Pageviews
- Time on Site
- Bounce Rate
Visitor Loyalty
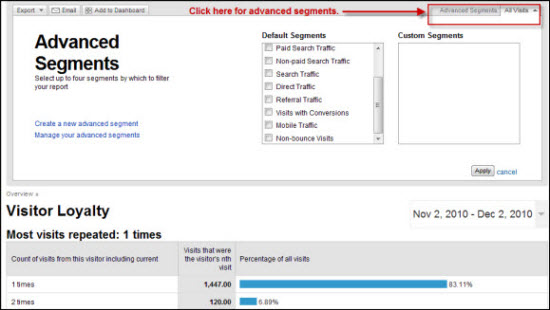
It lets you know type of loyalty your visitors have with your site. Different kinds of Visitor loyalty are
- Loyalty
- Advanced Segments
- Recency
- Length of Visit
- Depth of Visit
Browser Capabilities
This data lets you know which browsers are most important for your business
- Browsers
- Operating Systems
- Browsers and Operating Systems
- Screen Colors
- Flash Versions
- Java Support
Network Properties
This information helps you know what network-providers your site visitors use-
- Service Providers
- Host Names
- Connection Speeds
- Mobile
2. The Traffic Sources Tab
Within the visitors tab we can get more details regarding new vs returning visitors, languages, trending, loyalty, browser capability, network properties and even mobile data.
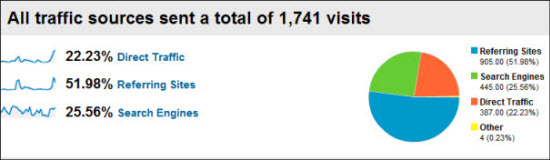
Where is your sites traffic coming from? This tab allows you to narrow traffic down by direct traffic, referring sites, search engines etc.
Overview
Takes you through the big picture of where all your traffic is coming from
Direct Traffic
Updates you about the traffic that comes to your site after manually typing your site URL
Referring Sites
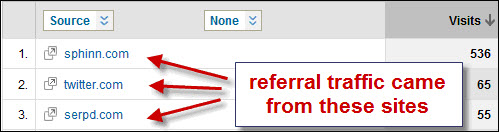
Sites from where referral traffic came
Search Engines
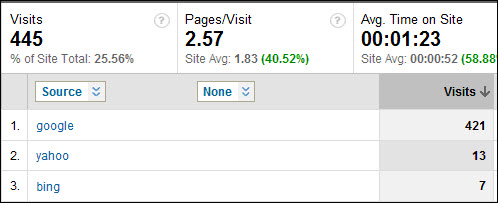
To know which search engine is sending the most traffic
All Traffic Sources
Comprehensive details of all sources that sent traffic to your site
Keywords
Updates you about all the keywords that generated traffic for your site
Campaigns
Helps you track the campaign traffic of any PPC, RSS feed or Newsletter
Ad Versions
Shows different ad versions that you use
AdWords Overview (Additional account set up necessary)
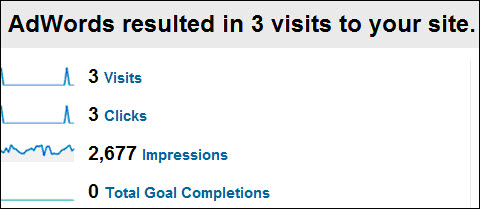
Helps you see details of PPC campaign through Analytics Account
Campaigns
Helps you see all the campaigns you have setup and run in Google AdWords
Day Parts
Helps you know what parts of day your campaign gets most clicks
Destination URLs
Lets you know the landing page that your visitors start their visit on your site
Placements
Helps you analyze performance of your Ads and optimize your placements
Keyword Positions
Helps you know where your PPC ads are listed when visitors are clicking on them
TV ads
This lets you analyze your full TV advertising opportunities
3. The Content Tab
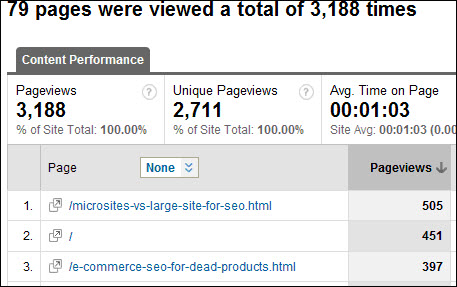
This tab is the place where you can know what content is generating the most visits for your site, which sections of your site is getting most numbers of clicks, plus, you can know your top landing and exit pages. Other sub tabs in Content tab are-
Overview
Provides you a quick view of unique views, number of pages viewed, bounce rates, list of your sites’ top content, etc.
Top Content
Gives you information of that specific page that brings in the most traffic
Content by Title
Helps you find out most popular titles
Content Drilldown
Helps you access the content data that is in a lower level of a hierarchically structured database
Top Landing Pages
Lets you know about the top page that people first visit when they reach your site
Top Exit Pages
Updates you about the top page from which most of the visitors exit your site
Overview
This opens up the home page of your site and updates you about the number of people clicking on your site
Site Search (Advanced configuration required)
Helps you know what kinds of search queries your visitors are typing
Event Tracking (Advanced configuration required)
Updates you when someone clicks on download, video, outbound link and other events on your site content
4. The Goals Tab
Goals tab helps you track how many people have completed your site goals. Subtabs of Goals tab are-
Overview
Reports you about how many visitors have completed your site goals
Total Conversions
Updates you about the conversions in a certain amount of time
Conversion Rate
Updates you about what percentage of your site visitors complete your site goals
Goal Verification
This lets you know a point in which a goal has been met
Reverse Goal Path
This will help you know what your visitors were doing before they finished the goal you set up
Goal Value
Allows you set an specific value for each goal that is achieved
Goal Abandoned Funnels
This lets you know about the people who were involved in the conversion process but left your site without completing the goal
Funnel Visualization
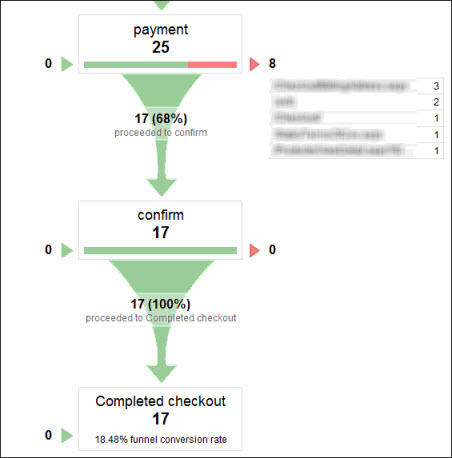
This tab lets you know from where your visitors are leaving your site. This information helps you find out ‘issue pages’ in your conversion process
Conclusion
On the concluding note, I hope you would have understood what is Google Analytics and how you can use it to tracking your site’s performance in the most organized and result-driven manner.
Learning Google Analytics is the primary step of Web Analytics Training that not only helps you learn basic metrics and main sections of Google Analytics, but also aids you make a successful career in Analytics.
What are the things about your website you would try to know after completing this ‘what is Google Analytics guide’? Please share your experience in the comments!


Actually, I am learning Google Analytics by own so this article is really helpful to me. Thanks for sharing