
ANOVA in Excel or Analysis of Variance is a useful statistical function that lets you test different data sets to figure out the extent of difference among them.
Suppose, a businessman has introduced a new e-commerce feature on his site that would purportedly increase the sale volume.
With Anova in Excel, you can compare the ‘before and after implementation’ sale figures for various merchandise classes listed on site and map the leap or subsidence in sales volumes.
Prior to conducting Anova in Excel, a null hypothesis is set up against which the outcome of your decision is testified.
Trivia: With Anova, you can test the degree of differences among means of various relevant data samples with 100% accuracy.
Do you know that the test for independent or dependent samples is used by leading organizations worldwide to understand the impact of changes implemented?
How To Do Anova in Excel?
Before calculating Anova in Excel, you need to have a fair understanding of the various factors that have a bearing on the variables and factors in Anova. This post would take you through the same.
Test Your Understanding About Manova, Two and One Way Anova in Excel
1) What is the basic concept behind Anova?
ANOVA is a statistical method that assesses the degree of difference in the means of 2 or more data groups or samples. This comparison would help in checking the extent to which sample groups are impacted by different factors. ANOVA in Excel is used for comparing samples.
2) What are the main terminologies used in Anova?
It is essential to have an idea of the various terminologies used in Anova. This would ease the process of calculating two or one-way ANOVA in Excel. The ‘Grand Mean’ signifies the average of sample means of various observations or individual members of sample data sets.
‘Hypothesis’ is an informed guess about the effect of one decision on the sample data. The validity of the hypothesis can be tested through empirical data or observation.
‘ Group Variability’ refers to the difference between the grand mean and means of individual data samples. If the values in respective sample groups are distributed differently, the variability quotient would be higher.
‘Within-Group Variability’ is an indication of the variability factor inside individual data samples owing to the dissimilarity of various constituting sample values.
When considering how to do Anova in Excel, another factor that you must consider is F-Statistic.
This is measured through F-Ratio which is the quotient of division between ‘Between Group Variability’ and ‘Within-Group variability’. If the F-Ratio is low, the means of data samples are almost similar and the null hypothesis applies.
3) How is Anova calculated in MS Excel?
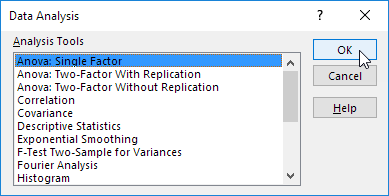
Before using Anova in Excel, you need to ensure that the Analysis Toolpak Add-in has been loaded in the main module. On the top ribbon in Excel, click on the Data tab, navigate to Analysis group and then click on Data Analysis.
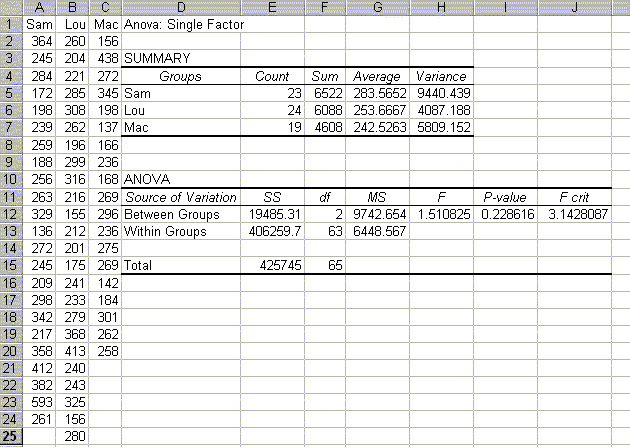
The window depicted below would pop up. For the time being, select ‘Anova: Single Factor’ and click ok.
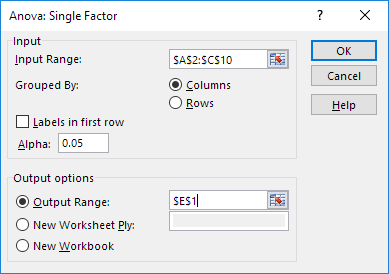
In the ‘Input Range Box’, select the cell range wherein your sample data lies. Specify the cell in which output is to be displayed in the ‘output Range’ box. Click Ok.
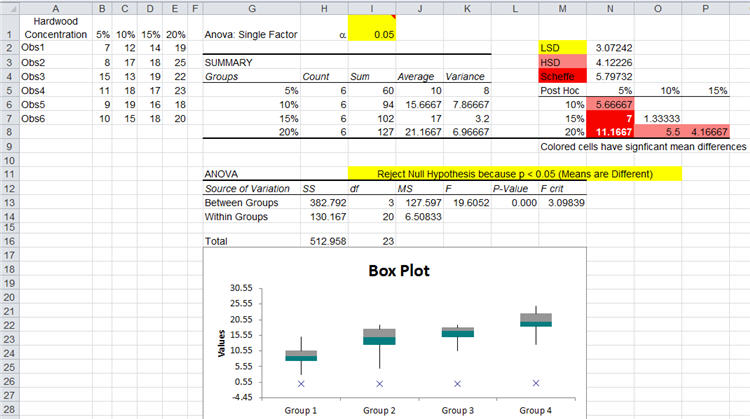
The result would be displayed.
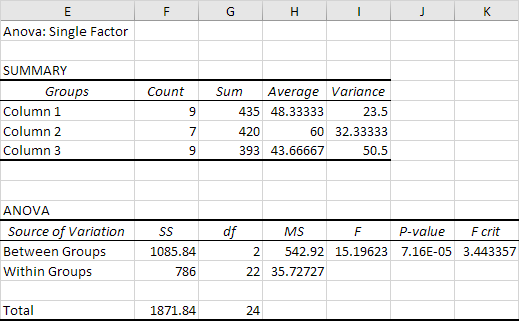
In the aforesaid image, if F is greater than F crit, the possibility of the null hypothesis is rejected as means of sample data are unequal. But to identify the difference, a t-test between each data pair has to be conducted. Now you know how to calculate Anova in Excel. Try it yourself.
You can learn more about the process in this video.
4) What is the difference between one-way and two-way Anova?
One way ANOVA in Excel assesses the presence of ‘statistically significant differences’ among the means derived for 3 or more independent data samples. Two-way ANOVA allows comparison of the differences in means of sample data groups.
The sample data groups are divided based on factors or two independent variables. With two-way Anova, the interaction of these factors with the dependent variable is analyzed. For example, exercise and exercisers are independent variables and body mass is the dependent variable.
5) What are the assumptions for calculating Anova?
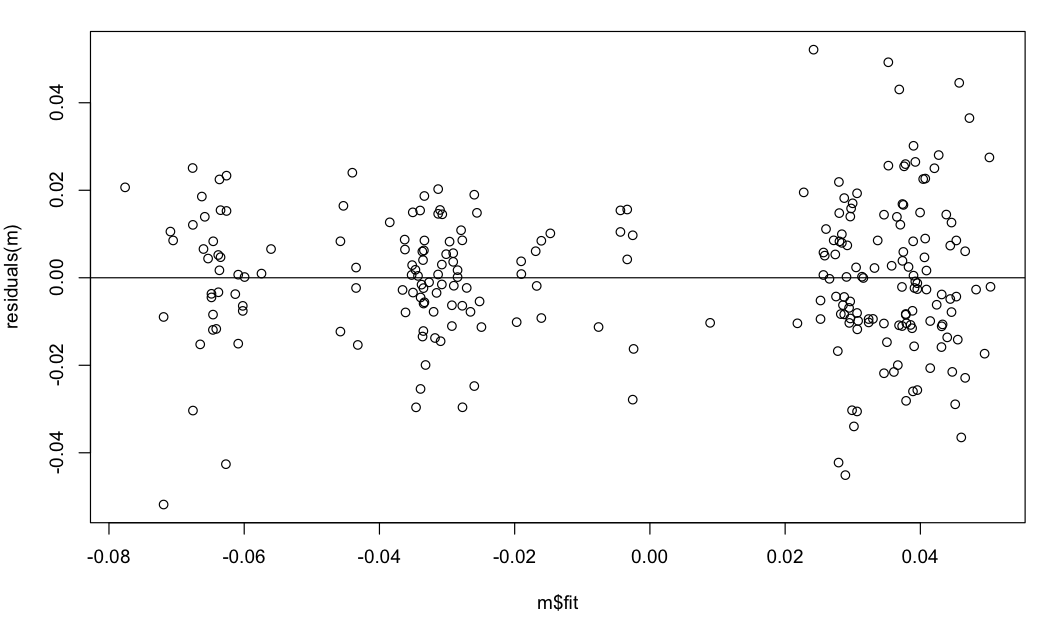
Before calculating Anova in Excel, you need to be aware of three basic assumptions. The first is ‘Independence of cases’ which is intended for simplification of statistical analysis. The second is ‘Normality’ wherein it is assumed that the residual distributions are normal.
The third is ‘Homogeneity’ or ‘Homoscedasticity’ which concerns itself with the equality among variances.
6) What are the various notations used in Anova?
For effectively understanding how to calculate Anova in Excel, you must be aware of the various notations used. ‘n’ is the number of individuals in any data sample. ‘l’ refers to the number of sample data groups. X̅ is the mean for a given sample data set.
‘ni’ is the number of individual members in a sample data group i. ‘Si’ is the standard deviation for the group i.
7) What is Manova (Multivariate Anova)?
Manova is Multivariate Analysis of Variation whereas Anova is a one-way Analysis of Variation. The number of variables or factors involved is Manova is greater than one. Manova is useful in cases wherein the dependent variable is affected by a number of factors.
8) How is Manova calculated in Excel?
In Manova, a linear combination of dependent variables is used. For calculating Manova in MS-Excel, you need to start by downloading ‘RealStats’ add-in available online.
Once done, open the RealStats window and select ‘Analysis of Variance’ followed by ‘Manova: Single Factor’.
Select the input range of cells containing the data in the ‘Input Range’ box. The headers, as well as group names, should be selected. Next, define the output range. Specify the alpha level which usually is 0.05 or 5%.
Click Ok and generated data would be populated in the output range.
9) What is the p-value and Alpha in Anova?
Prior to running the statistical test, the alpha level has to be determined which is also known as the ‘significance level’ test. It indicates the probability of null hypothesis rejection provided that null hypothesis holds true. You can understand if your decision is wrong.
The p-value indicates the probability of getting an extreme result as compared to the result which you may get if the null hypothesis becomes true.
When the hypothesis test is run for calculating Anova in Excel, confidence interval has also to be factored in. The confidence interval denotes the range of similarly valued factors for a sample data set. The population mean is an example of the confidence interval.
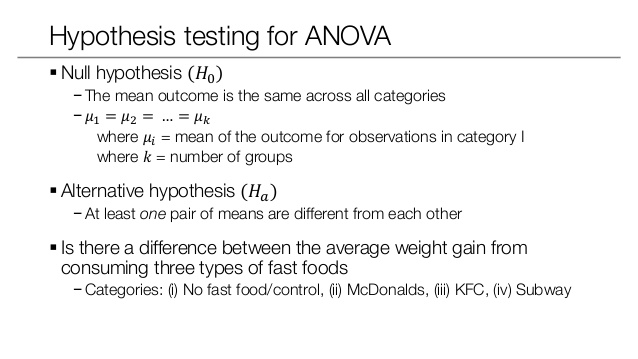
10) What do you mean by Hypothesis in Anova?
Hypothesis, as discussed earlier, is a guess that you make about the impact one data set, upon being changed, would have on another. When figuring out how to calculate Anova in Excel, you would come across two hypothesis types.
The null hypothesis holds true when the means of all sample datasets are the same or have negligible difference among them.
This implies that the members of the sample data form a part of the data population which is significantly larger in size.
Another hypothesis that you would come across while determining Anova in Excel is ‘alternate hypothesis’. This guess is valid if any of the various sample means is not tallying with remaining means.
In the null hypothesis, the change factor in one data set would not have a meaningful impact on the results. In an alternate hypothesis, the nominal impact is there but it is hard to identify which change is causing that effect to take place.
11) Briefly describe the steps you need to interpret the results of Anova calculation in Excel.
In order to analyze the results of hypothesis tests conducted, you need to keep in perspective three factors. Your whole exercise related to how to calculate Anova in Excel would be futile if you don’t know how to interpret the results.
The first fact is that Confidence level + alpha level would be 1. If alpha is 0.05 then the confidence level would be 0.95. If alpha is increased, the potential of wrong rejection of null hypothesis increases which decreases the confidence level.
The second fact is that p-value can be lesser than alpha. If you are ready to make assumptions that can prove wrong, the null hypothesis can be rejected. If the p-value is taken as 0.02, alpha is 0.05, then the null hypothesis can be rejected.
However, if the p-value is larger than alpha, then the null hypothesis cannot be rejected. A higher p-value would cause the null hypothesis to dominate the decision-making process.
The third fact when the calculated results of Anova in Excel are construed is that same conclusion is directed to by the confidence interval and p-value. If the alpha is significantly greater than p-value, then hypothesized mean would not be contained in the confidence interval.
12) Where does Anova find the useful application?
Anova is used in multiple ways. Research design usually determines the Anova’s use. In one way Anova, only 1 independent variable is present. For example, the difference in income groups of merchants in a state can be compared.
In two-way ANOVA, 2 independent variables come into play. In the above example, the state is independent variable 1 and if merchants’ gender is also considered, it becomes variable 2. Income is the dependent variable.
The interaction among 2 independent variables can be compared and analysed using 2-way Anova.
The non-uniformity of differences across various segments of independent variables can be understood from the interactions. Income of male merchants may be more than female merchants.
N-way Anova is used by researchers for comparing n numbers of independent variables.
Final Words About Anova in Excel
Anova is a reliable and insightful method of analysing variability among various independent variables. By now, you must have become aware of how to do Anova in Excel. Anova is an important tool in the flourishing domain of Data Science & Analytics.
By leveraging your understanding of how to calculate Anova in Excel, you can now confidently establish the cause of variation among data sets and take informed and conscious decisions. While precision is totally required, there are Advanced Excel Tips that Every Data Analyst should know to make their work faster and easier.
Image Credits: Math Colgate, Stack Exchange, Excel Easy, Statistics Laerd, Slideshare and Qimacros.