Correlation and Regression are the two most commonly used techniques for investigating the relationship between two quantitative variables.
Correlation is often explained as the analysis to know the association or the absence of the relationship between two variables ‘x’ and ‘y’. Spearman’s correlation coefficient rho and Pearson’s product-moment correlation coefficient are the two most popular correlation coefficients.
The term “regression” was coined by Francis Galton in the nineteenth century to describe a biological phenomenon.
It was believed that the heights of descendants of tall ancestors tend to regress down towards a normal average (a phenomenon is also known as regression toward the mean).
Regression, on the other hand, predicts the value of the dependent variable based on the known value of the independent variable, assuming that the average mathematical relationship between two or more variables. There is a lot of ambiguity in understanding the concepts.
In this discussion, we aim to discuss Correlation and Regression concepts in detail, the difference between Correlation and Regression and Correlation and Linear Regression examples.
Correlation and Linear Regression
To sum up, in a single sentence, we may say that Correlation and Regression are the two analysis based on multivariate distribution. A multivariate distribution is described as a distribution of multiple variables.
Correlation is described as the analysis which lets us know the association or the absence of the relationship between two variables ‘x’ and ‘y’.
Regression analysis, on the other hand, predicts the value of the dependent variable based on the known value of the independent variable, assuming that the average mathematical relationship between two or more variables.
See video on Correlation and Linear Regression explains the relationship between variables with illustrative examples:
Correlation and Linear Regression: What is Correlation?
Correlation may be explained as a combination of two words ‘Co’ (being together or co-exist) and relation (the connection between two or more entities) between two quantities.
Correlation as far as my observation goes is the study of two variables when a unit change in one variable is retaliated by an equivalent change in another variable. That is to say, a direct or indirect change takes place.
Otherwise, the variables are said to be uncorrelated when the movement in one variable does not amount to any movement in another variable in a specific direction. It is a statistical technique that represents the strength of the connection between pairs of variables.
Correlation can be both positive and negative. This means, when the two variables move in a unilateral direction, i.e. an increase in one variable will result in the corresponding increase in another variable and vice versa, then the variables are considered to be positively correlated. A classic example may be that of profit and investment.
On a different note, when the two variables move in different directions, in such a way that an increase in one variable will result in a decrease in another variable and vice versa.
This situation is known as a negative correlation. A classic example of this may be Price and demand for a product.

Correlation and Linear Regression: Measures of Correlation
The measures of Correlation may be represented as follows:
(i) Karl Pearson’s Product-moment correlation coefficient
(ii) Spearman’s rank correlation coefficient
(iii) Scatter diagram
(iv) Coefficient of concurrent deviations
Correlation and Linear Regression: What is Linear Regression?
Linear Regression may be defined as a statistical technique for estimating the change in the metric dependent variable due to the change in one or more independent variables, based on the average mathematical relationship between two or more variables is known as regression. Linear Regression plays a significant role in several human activities, it being a powerful and flexible tool used for forecasting the past, present or future events on the basis of past or present events.
This may better be explained with the following example: the business profit of an organization may be estimated based on past records.
In simple linear regression, there are two variables x and y, wherein y depends on x or say influenced by x. Here y is called as a dependent, or criterion variable and x is independent or predictor variable. The regression line of y on x is expressed as under:
y = a + bx
where, a = constant,
b = regression coefficient,
In this equation, a and b are the two regression parameters.

Correlation and Linear Regression Examples
Correlation and Linear Regression is used when you have two measurement variables, such as food intake and weight, drug dosage and blood pressure, air temperature and metabolic rate.
There’s another nominal variable that keeps the two measurements together in pairs; such as the name of an individual organism, experimental trial, or location.
The main value of the hidden nominal variable is that it lets me make the blanket statement that any time you have two or more measurements from a single individual (organism, experimental trial, location, etc.), the identity of that individual is a nominal variable; if you only have one measurement from an individual, the individual is not a nominal variable.
How does this rule help?
I think this rule helps clarify the difference between one-way, two-way, and nested ANOVA. If the idea of hidden nominal variables in regression confuses you, you can ignore it.
There are three main goals for correlation and regression in biology. One is to see whether two measurement variables are associated with each other; whether as one variable increases, the other tends to increase (or decrease). You summarize this test of association with the P-value.
In some cases, this addresses a biological question about cause-and-effect relationships; a significant association means that different values of the independent variable cause different values of the dependent.
A Correlation and Linear Regression example would be giving people different amounts of a drug and measuring their blood pressure. The null hypothesis would be that there was no relationship between the amount of drug and blood pressure.
If you reject the null hypothesis, you would conclude that the amount of drug causes changes in blood pressure. In this kind of experiment, you determine the values of the independent variable; for example, you decide what dose of the drug each person gets.
The exercise and pulse data are an example of this, as I determined the speed on the elliptical machine, then measured the effect on pulse rate.
Correlation and Linear Regression Examples: Detailed
In other cases, you want to know whether two variables are associated, without necessarily inferring a cause-and-effect relationship. In this case, you don’t determine either variable ahead of time; both are naturally variable and you measure both of them.
If you find an association, you infer that variation in X may cause variation in Y, or variation in Y may cause variation in X, or variation in some other factor may affect both Y and X. An example would be measuring the amount of a particular protein on the surface of some cells and the pH of the cytoplasm of those cells.
If the protein amount and pH are correlated, it may be that the amount of protein affects the internal pH; or the internal pH affects the amount of protein; or some other factor, such as oxygen concentration, affects both protein concentration and pH.
Often, a significant correlation suggests further experiments to test for a cause and effect relationship; if protein concentration and pH were correlated, you might want to manipulate protein concentration and see what happens to pH, or manipulate pH and measure protein, or manipulate oxygen and see what happens to both.
The amphipod data are another example of this; it could be that being bigger causes amphipods to have more eggs, or that having more eggs makes the mothers bigger (maybe they eat more when they’re carrying more eggs?), or some third factor (age? food intake?) makes amphipods both larger and have more eggs.

More Examples describing the goals
The second goal of correlation and regression is estimating the strength of the relationship between two variables; in other words, how close the points on the graph are to the regression line.
You summarize this with the r2 value. For example, let’s say you’ve measured the air temperature (ranging from 15 to 30°C) and running speed in the lizard Agama savignyi, and you find a significant relationship: warmer lizards run faster.
You would also want to know whether there’s a tight relationship (high r2), which would tell you that air temperature is the main factor affecting running speed; if the r2 is low, it would tell you that other factors besides air temperature are also important, and you might want to do more experiments to look for them.
You might also want to know how the r2 for Agama savignyi compared to that for other lizard species, or for Agama savignyi under different conditions.
The third goal of correlation and regression is finding the equation of a line that fits the cloud of points. You may use this equation for prediction.
For example, if you have given volunteers diets with 500 to 2500 mg of salt per day, and then measured their blood pressure, you could use the regression line to estimate how much a person’s blood pressure would go down if they ate 500 mg less salt per day.
By now, you must be having a clear understanding of Correlation and Linear Regression examples.

Correlation and Linear Regression: Differences between Correlation and Linear Regression
Correlation and Linear Regression, though similar in many respects and interdependent on each other are also different in many ways. Let us take a look at some major points of difference between Correlation and Linear Regression.
Correlation is a statistical measure which determines the co-relationship or association of two quantities. Regression, on the other hand, describes how an independent variable is numerically related to the dependent variable.
Correlation is mostly used to represent the linear relationship between two variables. Regression is recommended for determining the best fit in line and estimating a variable on the basis of another variable.
When talking about the difference between correlation and regression, we find that in Correlation, there is hardly any difference between a dependent and independent variables, i.e., the correlation between x and y is similar to y and x. Conversely, the regression of y on x is different from x on y.
Correlation brings out the strength of association between variables. On the contrary, Regression indicates the impact of the unit change in the independent variable on the dependent variable.
Correlation intends to find a numerical value that expresses the relationship between variables. Regression, on the other hand, aims at predicting values of the random variable on the basis of the values of a fixed variable.
Correlation and Linear Regression: Relationship between Correlation and Regression
Correlation and Regression may have their differences. But they are also dependent upon each other. The relationship between Correlation and Regression may be explained with an example.
The degree of association is measured by R after its originator and a measure of linear association. Other complicated measures are used if a curved line is needed to represent the relationship.
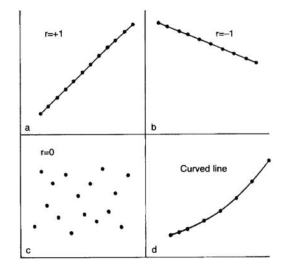
The above graph represents the correlation.
The coefficient of correlation is measured on a scale that varies from +1 to -1 through 0. The complete correlation between two variables is represented by either +1 or -1. The correlation is positive when one variable increases and so does the other; while it is negative when one decreases as the other increases. The absence of correlation is described by 0.
For a better understanding of the relationship between correlation and regression, you may browse through video tutorials or look up for discussions in tech forums.
Correlation and Regression, both being statistical concepts are very much related to Data Science. So, if you have a background in statistics, and want to take up a career in statistical research on Correlation and Regression, you may sign up for a degree course in data analytics as well. It will give your career the much-needed boost.
The exponential rise of data has led to an unprecedented demand for Big Data scientists and Big Data analysts. Enterprises must hire data science professionals with a strong knowledge of Deep Learning and Big Data applications.
Conclusion
However, there is a sharp shortage of data scientists in comparison to the massive amount of data being produced. This makes hiring difficult and more expensive than usual.
You might be a programmer, a mathematics graduate, or simply a bachelor of Computer Applications. Students with a master’s degree in Economics or Social Science can also be a data scientist.

Take up a Data Science or Data Analytics Course, to learn Data Science skills and prepare yourself for the Data Scientist job, you have been dreaming of. Digital Vidya offers one of the best-known Data Science courses for a promising career in Data Science using Python.
Its industry-relevant curriculum, pragmatic market-ready approach, hands-on Capstone Project are some of the best reasons for choosing Digital Vidya.
In addition, students also get lifetime access to online course matter, 24×7 faculty support, expert advice from industry stalwarts, and assured placement support that prepares them better for the vastly expanding Data Science market.


Found your post interesting to read. I can’t wait to see your coming up post. Good Luck for the upcoming update.This article is really very interesting and effective.