
Data analysis is increasingly gaining popularity, and the question of how to perform data analytics using R? is also becoming important, due to the importance of R as a tool that enables data analysts to perform data analysis and visualization. An important term coined in data analytics using R is exploratory data analysis, it is an approach of data analysis employed for summarizing and visualizing data set, the concept is designed by John Tukey, and the focus of the approach is to analyze data’s basic structures and variables to develop a basic understanding of the data set, in order to develop an in-depth understanding of the data’s origin and to investigate what methods of statistical analysis would be appropriate for data analysis. In order to explain the concept in details, this article will first discuss a software R, employed for data analysis, and then describe how and why R can be employed to analyze data effectively.
What is R?
R is a software adapted by statistical experts as a standard software package for data analysis, there are other data analysis software i.e. Python as well, but this article deals with how to analyze data using R. The software is a software driven by command, e.g. if you are a data analyst analyzing data using R then you will be giving written commands to the software in order to indicate what you want to do, the advantage of using R is that it lets the analysts collects large sets of data and add different commands together and then process all the commands together in one go. The reason why R should be used in data analysis is because it helps in processing large number of commands together, saves all the data and progress on work, and enables analysts to easily edit small mistakes so that they don’t have to go through different commands to retrace their steps and find the mistake and then fix it.
Currently R is a free software that can be downloaded for free on Windows, Linux, Unix or OS X.
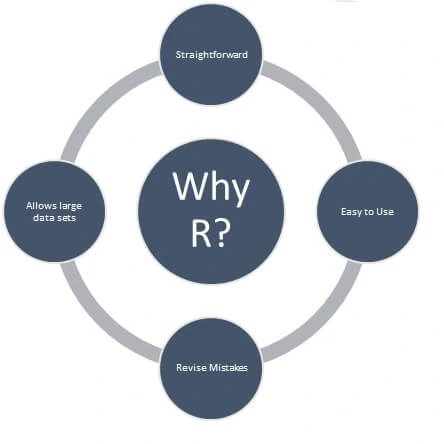
Why analyze data using R?
- Straightforward handling of analyses using simple calculations
- Easy to learn for beginners
- Simple and advanced options of analysis available
- Flexible
- Provides both application area and statistical area specialties
- Ability to easily fix mistakes

Data analysis using R is increasing the efficiency in data analysis, because data analytics using R, enables analysts to process data sets that are traditionally considered large data-sets, e.g. previously it was not possible to process data sets of 500,000 cases together, but with R, on a machine with at least 2GB of memory, data sets off 500,000 cases and around 100 variables can be processed.
What exactly Data Analytics using R contains?
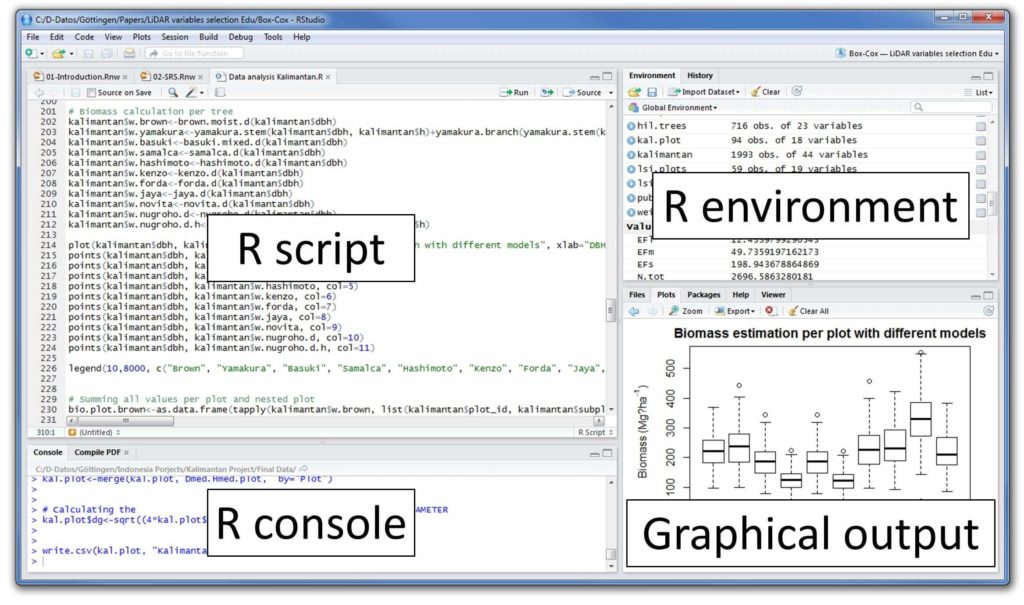
Before developing an in-depth understanding of what exactly data analytics using R contains it is important to understand the basic interface of R. The R software has four basic features, R Console, R Script, R environment and Graphical output. If all of these features are summarized R has the ability to enable analysts to write codes in console, then run commands through script, analyze variables and sets in R environment and then present the data in the form of graphical output. In simple 4 steps, users can analyze data using R, by performing following tasks:
- R-Console: Using R console, analysts can write codes for running the data, and also view the output codes later, the codes can be written using R Script.
- R-Script: R script is the interface where analysts can write codes, the process is quite simple, users just have to write the codes and then to run the codes they just need to press Ctrl+ Enter, or use the “Run” button on top of R Script.
- R Environment: R environment is the space to add external factors, this involves adding the actual data set, then adding variables, vectors and functions to run the data. You can add all your data here and then also view whether your data has been loaded accurately in the environment.
- Graphical Output: Once all the scripts and codes are added and data sets and variables are added to R, graphical output feature could be used to create graphs after the exploratory data analysis is performed.

Thus, if based on above features, the functioning of data analytics using R is analyzed, then data analytics using R entails writing codes and scripts, uploading sets of data and variables, i.e. uploading the information you know, to obtain the information you want to find out, and then represent the results using visual graphs.
What is R programming for data science?
Data analytics with R is performed using four features of R, mentioned above, R console, R script, R environment and Graphical output. The R programming for data science contains different features and packages that can be installed to analyze different types of data, R data analytics enable user to analyze different types of data such as:
Vector: Vector data sets group together objects from same class, e.g. a data set with vectors could contain numeric, integers etc. However, R data analytics allows mixing of different objects, i.e. different vectors can be grouped together for analysis. In this article we are not going in-depth of specific commands that can be performed to group different objects into one group, but the process of combining different groups into one group causes coercion, and using the command class function, the data can be grouped into one object of the same class.
Matrices: A matrix data set is created when a vector data set is divided into rows and columns, the data contains the elements of the same class, but in matrix form the data structure is two dimensional.
Data Frame: Data frame could be considered an advanced form of matrix, it is a matrix of vectors with different elements, the difference between a matrix and a data frame is that a matrix must have elements of the same class, but in data frame lists of different vectors with different classes can be grouped together in a data frame. The data frame commands could be more complex than the rest.
List: List is a specific term used to describe a vector data set that groups together data from different classes.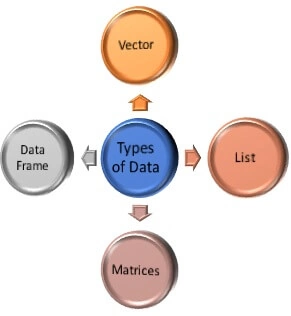
Apart from the R programming for data science that allows analysis of different types of data, R data sciences allows for different types of variables to be added, such as:
Continuous Variables: continuous variables are variables that can be in any form of value, e.g. decimal values can also be added to the data, such as 1, 2.5, 4.6, 7, etc.
Categorical Variables: categorical values can only be added in one form such as 1, 2, 3,4,5 etc. Factors are used for representing categorical variables in data analytics with R.
Missing Values: missing values are painful yet a crucial part of data analytics, and R data analytics. There are different commands such as NA to perform calculations without the missing values, but when the values are missing, it is important to use commands to indicate that there are missing values in order to perform data analytics with R.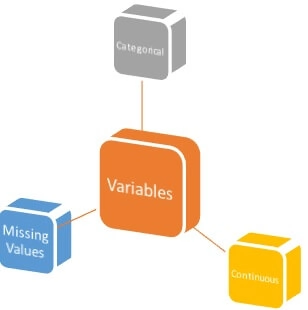
In addition to different types of data sets and variables, R programming for data sciences has different control structures such as:
If, else: If is used to test a certain condition, this could be used to generally find a relation, such as if x fails what would be the result on y?
For: For is a command used to execute a loop for certain number of times, for can be used to set a fix number that an analyst want for the iterating.
While: While is used for testing a condition, and it lets the process continue only if the condition analyzed is true. Once the initiated loop is executed then the condition can be tested again, if the condition needs to be altered in case it’s not true, it must be done before using the while command or the loop will be executed infinitely.
In addition to the above control structures there are some additional control structure such as repeat, which allows execution of an infinite loop, break for breaking the execution of a loop, next for skipping an iteration in a loop, and return for exiting a function.
R programming for data science is not that complex and the reason for its popularity is its ease of use and the free download, but in order to learn Data Analytics with R, it is important to study the software in detail, learn different commands and structures that are in R and then perform the commands accordingly to analyze data effectively. In order to help you familiarize you with R, we have already described basics of data analytics with R, but to learn the software, we have prepared some tips that could help you study R for data analytics.
How should I study R for Data Analysis?
Data analysis with R has been simplified with tutorials and articles that can help you learn different commands and structure for performing data analysis with R. However, to have an in-depth knowledge and understanding of R Data Analytics, it is important to take professional help especially if you are a beginner and want to build your career in data analysis only. R is a powerful tool that helps not only in data analysis but communication of the results as well through its feature of visual graphs and presentation, i.e. in the following picture: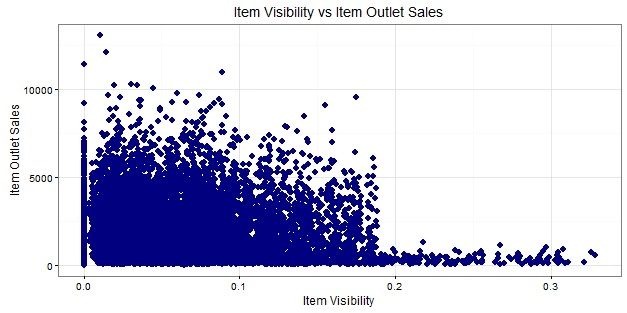
However, in order to study for R, don’t just depend on tutorials and articles and find an institute that is offering classes on data analysis. The benefit of finding classes will not only be that you will be able to learn R data analytics, but you will also be able to learn data analysis using other tools.
In addition to finding an institute it is crucial to gain experience in data analysis in order to actually know what you are doing. Initially when you find a course, ensure that the course is offering real life project experiences, so that you can analyze real-time data to test your skills, and then also try to find independent projects and work for yourself, and people who will invest in your long-term training. This could entail working with or interning with companies who are currently investing in data analysis workforce.
R is an easy to use tool with an excellent interface, however learning it could take time, in order to study for it, it is important for you to first understand in detail what the software is and what it does, and that could be done both through independent research and professional analysis.
If you don’t have any knowledge of data analysis at all and you are a complete novice, then it is important for you to register yourself in a course that can first help you understand what data analysis is and then you can move to performing R Data Analytics.