Data cleaning is utmost important for any kind of data before you can make sense out of it and generate reports.
Let’s say you get a ton of data which is extremely inconsistent in spaces, Mumbai is spelled as “Mumbai”, “Mum bai”, “ Mumbai”, “Mumbai ”, “M Mumbai”. All these 6 different spellings of Mumbai will be treated as 6 different cities in your report, which will not make any sense and in fact, can make you take wrong business decisions if you don’t realize.
Data cleaning in Excel
In Excel, we have a lot of functions to do this kind of cleanup of spaces and many more data cleaning techniques. Some of the functions are,
=TRIM is used for removing extra spaces.
=CLEAN is used to remove all non-printable characters from a cell
=UPPER is used to convert all characters into Capital (upper) case
=LOWER is used to convert all characters into Small (lower) case
=PROPER is used to convert the 1st character of every word in the cell, into Uppercase, and all other characters into Lowercase
=LEN is used to count the number of characters in a cell including spaces
=LEFT is used to extract ‘x’ number of characters from the left side of a string
=RIGHT is used to extract ‘x’ number of characters from the right side of a string
=MID is used to extract ‘x’ number of characters from anywhere in the middle of a string
=FIND is used to find the location of the character/text you are looking for in the string (case sensitive)
=SEARCH is used to find the location of the character/text you are looking for in the string (non-case sensitive)
=REPLACE is used to replace all or part of a text string with another string
=SUBSTITUTE is used to substitute all occurrences of a search text string, within an original text string, with the supplied replacement text
=VALUE is used to convert a text string into numeric values
=CONCATENATE OR =CONCAT are used to combine the content of 2 or more cells
Text to Columns is another feature in Excel that is used to split the content of a cell into multiple columns (multiple cells sideways).
Data cleaning in Power BI
Such data cleaning techniques are available in Power BI as well, plus the best part is you don’t have to use any DAX functions for it. Options are readily available on the menu itself, under the Transform tab in the Edit Queries window.
Let’s explore the Features
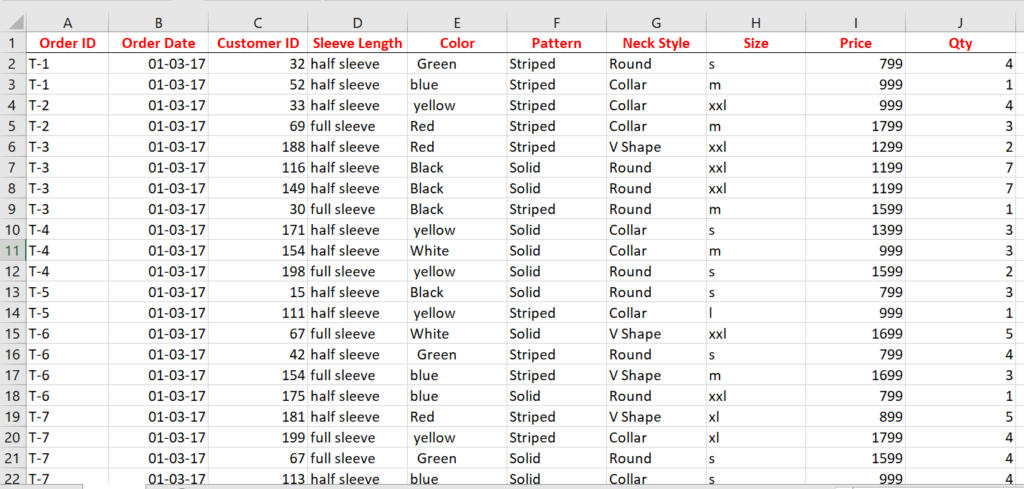
We will be taking the below sample Excel data and import it into Power BI first, then start exploring many of these data cleaning features of Power BI.
Let’s observe each column carefully and note down what cleaning each one needs: –
- Order ID – The T and number need to be split into 2 different columns
- Order Date – is fine, but we want this to be the 1st column in the dataset
Also, we want to extract the month out of the Date into a separate column - Customer ID – is fine, but we want a ‘C’ before each ID
- Sleeve Length – must be Proper case (convert the 1st character of every word in the cell, in Uppercase, and all other characters into Lowercase)
- Color – must be Proper case as well as must be Trimmed (extra spaces before, after and in between words must be removed)
- Pattern – is fine, but we want to keep only the first 2 characters – St & So, and then make it Uppercase
- Neck Style is fine
- Size – convert it to Uppercase
- Price is fine
- Qty is fine
- Total = add a column which multiplies Price * Qty
We shall go step by step and understand how to do each of them
ORDER ID
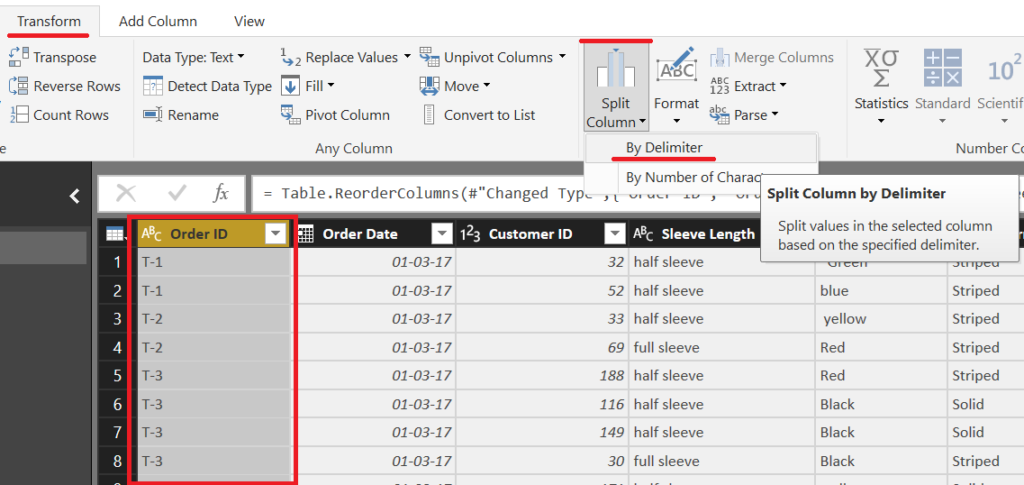
To split a column, based on a delimiter (a character which divides the content),
- Select the column
- Under the Transform tab, click on Split column -> By delimiter
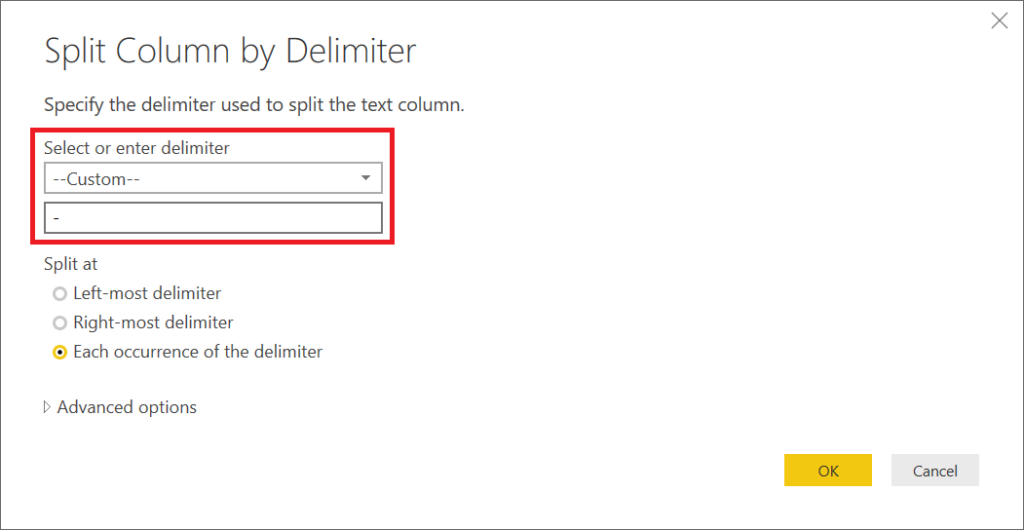
- Enter a – in the box and press enter
- You can even explore the other options apart from custom if your delimiter is not a –
- Data is now split into 2 columns
- Simply rename the columns by double-clicking on the header
- Or if you want to delete the column with the T’s, you can simply select the column, right-click and delete it.
ORDER DATE
To move the column to be the 1st column in the dataset, simply select the column, under Move option, click on To Beginning.
To extract the Month, select the column and first duplicate it by right-clicking on it and selecting Duplicate Column.
The duplicate will be created at the end of the dataset.
Now, select the column, and under the Date option, Select Month and again Month.

CUSTOMER ID
To prefix a ‘C’ select the column, under the Format option, select Add Prefix.
Put a ‘C’ and press OK.

SLEEVE LENGTH
To convert into Proper Case, select the column, under the Format option, select Capitalize Each Word.
COLOR
To convert the Proper case, follow the same method we just did.
To Trim the data, under Format option, just click on Trim.
PATTERN
To extract the first 2 characters, select the column, under the Extract Option, select First Characters.
Then, put 2 and press OK.
You can ofcourse now convert it to Upper Case the same way we did earlier.
SIZE
Convert to upper-case exactly in the same way we have been doing.
TOTAL
To add a TOTAL column, first under the Home tab, click on Close & Apply.
This will apply and finalize all the changes we made to the data.
You will see such a window when the changes are getting applied internally.
Now, go to the Data View, then Modelling Tab.
Under that, click on New Column.
Enter the below formula.
Total – this will be the name of the new column that will be added
Sheet1[Price] – you have pointed to the Sheet1 table in Power BI’s Price column
* – Multiplication sign
Sheet1[Qty] – you have pointed to the Sheet1 table in Power BI’s Qty column
This will create a new column giving Total for each row of data.
OTHER DATA CLEANING FEATURES AVAILABLE
Apart from all of these, there are many more features, under the Edit Queries window -> Transform Tab: –
- Transpose
You can convert your horizontally growing data (row-wise), into columnar data. - Reverse Rows
You can sort the data in exactly the reverse manner it is right now. - Use First Row as Headers
If for whatever reason, Power BI has not recognized that your data’s first row is actually headers and not data, you can use this option. - Find & Replace
Replace Values – replace all “Mum bai” to “Mumbai” in 1 shot
Replace Errors – replace all errors in the data with 0 - Unpivot Columns
If your data is a report format kind of data, you can unpivot all the columns in 1 shot and make the data usable again - Add suffix
Same way we added prefix - Date Option
Year – Extract the Year, Start of Year (returns the first date of that year), End of Year (returns last date of that year)
Month – Extract the Start of Month, End of Month, Days in Month (number of days in that date’s month), Name of Month (January, March, November)
Quarter – Extract the Quarter of Year, Start of Quarter, End of Quarter
Week – Extract the Week of Year, Week of Month, Start of Week, End of Week
Day – Extract the Day, Date of Week, Date of Year, Start of Day, End of Day, Name of Day, Earliest Date, Latest Date - Time option
Similar options as Date
This way, data cleaning is a much easy effort in Power BI than in Excel. You don’t need to learn any functions/formulas and their readymade features are easy to understand and use quickly. Also, to apply cleaning like Proper and Trim, you don’t even need to create extra columns, like in Excel. Instead, it simply overwrites the data itself. Once this cleaning is done, go to the ‘Report’ view and start building your dashboards using various Visualizations present, like Line chart, Pie chart, Waterfall chart, Gauge chart, Funnel chart, card, maps.


