Data manipulation is an integral aspect of data science. Data needs to be structured for enabling machines to read it. However, it needs manipulation for humans to use it. As the amount of data being used and storage increases day by day, data manipulation becomes more critical than ever.
Don Henley had once stated,
There are no facts, there is no truth, just data to be manipulated.
This statement sumps up Data Manipulation as a whole. Let us go through what data manipulation is and how it is useful in the fields of data science and analytics.
What is Data Manipulation?
In simple terms, data manipulation is the processing of adjusting and altering data to make it easier and organized for us to read.
https://www.youtube.com/watch?v=u2-hzDi3Jgk
What is the Purpose of Data Manipulation?
Data manipulation is crucial for business operations and optimization, as it allows for the organization of data for better clarity and readability. It lets you work with the data in which you need it. It is beneficial for the business because of the following factors.

1) Data Consistency – Consistency in data allows it to be read and understood. Data from various sources may not have a unified view. However, data manipulation makes it easy for organizing and storing it.
2) Data Projection – Data manipulation makes it possible to use historical data for projecting the future and providing in-depth analysis, especially when it comes to financial transactions.
3) Create value from data – Data manipulation enables you to edit, delete, insert, or transform data. Thus, you can do more with the available data. When you know how to use data, it becomes better for your business.
4) Remove unnecessary data – Data can contain useless figures. Data manipulation allows you to remove unusable data. Cleansing your records is possible with data manipulation.
Download Detailed Brochure and Get Complimentary access to Live Online Demo Class with Industry Expert.
Steps for Manipulating Data
Here are the steps you should take if you want to get started with data manipulation.
1) Data manipulation is possible only if you have data to do so. Thus, you need a database that is created from data sources.
2) This data needs rearrangement and restructuring. Data manipulation allows you to cleanse your data.
3) Import and build a database for you to work on.
4) Data manipulation lets you combine, delete, or merge information.
5) Data analysis becomes easy when you manipulate data.
How Do You Manipulate Data in Excel?
Data manipulation in Python and Data manipulation in R are essential aspects of data manipulation. Let us now understand how to manipulate data before going into the more profound concepts of Data Manipulation in Python and R.
You are most probably aware of how to use MS Excel. Here are some tips that can help you manipulate data in Excel.
1) Formulas and functions – Some of the essential math functions in Excel are addition, subtraction, multiplication, and division. You must know how to use these critical Excel functions.
2) Autofill in Excel – This function proves useful when you want to use the same equation across multiple cells. Retyping the formula is one way of doing it. Another way is dragging your mouse to the bottom right corner of the cell and then downwards. It will help you apply the same formula to multiple rows at the same time.
3) Sort and Filter – Sorting and filtering options in Excel enables users to save a lot of time while analyzing data.
4) Removing duplicates – In the process of collecting and assimilating data, there are always chances of duplication of data. The Remove Duplicate function in Excel can help eliminate duplicate entries on the spreadsheet.
5) Separating, combining, and merging columns – One can always add or delete columns or rows in Excel. Organizing data also includes merging, separating, or combining different sheets of data.
Data Manipulation in R
Data Manipulation in R enables users to organize data better so that it becomes useful for analysis. We shall now look at three simple data manipulation techniques in R. They include the following.

Sub-setting
The objective behind creating subsets is to help in analyzing data. This process involves the division of data into small-sized samples. This process of creating samples is known as sub-setting.

Here are some methods of sub-setting in R.
1) $ – The dollar sign is useful for selecting single elements of data.
2) [[ – The double brackets operator in R is also helpful for returning a single component. Besides, it is also flexible because it refers to the elements by position rather than by name. Therefore, it is useful for data frames and lists.
3) [ – This operator in R returns multiple aspects of data. The indices within the single square brackets can be a character vector, a logical vector, or a numeric vector.
Example – The following command is used for retrieving five rows and all columns of an already-built in dataset ‘iris’.
1) > data (iris)
2) > iris [1:5, ]
Here are some applications of sub-setting data.
1) The duplicated () function in R can help find duplicate values and return a logical vector.
Example – > duplicated (c(1,2,1,3,1,4))
The output is as follows
False, False, True, False, True, False.
1) The complete.cases() function in R can help identify missing data during data analysis.
Manipulation that includes sorting and merging in R
Here is how you combine and merge datasets in R. You can do so in three ways.
1) Adding columns using cbind() in R – Adding columns makes sense only if both the sets have the same set of rows and the order of rows is identical. The data.frame or cbind() function can help you do so.
2) Adding rows using rbind() in R – The procedure is similar to that of adding columns. If two datasets have equal columns, you can add rows at the bottom using the rbind() function.
3) Combining data with different shapes using merge() in R – This function combines data based on common rows and columns.
The merge () function allows the combining of data in four ways.
1) Natural Join in R – It only keeps the rows that match from the data frames. Specify the argument all = FALSE
2) Full Outer Join in R – It ensures to keep all the rows from both data frames. Specify all = TRUE
3) Left Outer Join in R – It includes all rows in data.frame x and only those that match from data frame y. Specify all.x = TRUE
4) Right Outer Join in R – This function includes all rows in data frame y and only the matching ones from the data frame x. Specify all.y = TRUE
Similarly, other data manipulations in R include
1) Sorting data using sort() function
2) Ordering data using order() function
3) Matching data using the match() function.
Traversing Data with Apply() function in R
The Apply() function in R helps to traverse data.
1) Array or Matrix – The Apply() function traverses through the rows or columns while applying a function to each resulting vector and returns a vector of summarised results.
2) List – The Lapply() function can traverse a list by applying a function to each element and returns a list of the results.
Formula Interface in R
This function allows you to specify the columns to use when fitting a model. However, users should note that formula notation in R refers to statistical formulae and not mathematical equations. Therefore, the operator ‘+’ entails, including a column and not add two columns together.
| Operator | Example | Meaning |
| ~ | y ~ x | Model y as a function of x |
| + | y ~ a + b | Include both the columns a and b |
| – | y ~ a – b | Include column a but exclude b |
| : | y ~ a : b | For estimating the interaction of a and b |
| * | y ~ a * b | Include both columns a and b and their interactions, as well |
| | | y ~ a | b | Estimation of y as a function of a condition on b |
Data Manipulation in Python
We have seen various types of data manipulation in R. Similarly, Python is also one of the preferred languages for data scientists. Here are some methods of data manipulation in Python that can help users to analyze data better.

1) Pivot Table – Using pandas, you can produce MS Excel-style pivot tables in Python.
2) Boolean Indexing – This function is useful when the user wants to filter the values of a specific column depending on the conditions from another set of columns.
3) Apply Function – The Apply Function is one of the most commonly used functions for building new variables and working with data
4) Crosstab – The Crosstab function enables the user to get an original view of the data. It also provides scope for validating some fundamental hypotheses.
5) Merge data frames – If the user needs relating data from various sources, the Merge data frames function comes in handy.
6) Sort data frames – The sort_values() function is useful when the user wants to sort the panda’s data frame by one or multiple columns. Similarly, the sort_index() function helps sort the panda’s data frame by row index.
We have seen six different types of data manipulation in Python. There are some more such as plotting, cut function, impute missing values, and so on.
In this article, we have discussed different types of data manipulation in Excel, R, and Python. We have also seen its definition and understood its significance. However, many people confuse data manipulation and data modification. We shall now examine the primary differences between data modification and data manipulation.
What is data manipulation, and how is it different from data modification?
In a way, data manipulation seems similar in meaning to data modification. However, they are not mutually exclusive.
Data Modification is when the stored or the saved value in a computer changes to a different value.
Data Manipulation is extracting information and applying logic to it to produce an entirely different result set of data.
In other words, one can say that data is modified when you manipulate the data and store it in the same place.
We shall look at the difference between the two terms using a small example.
- If the value of a column in an MS Excel sheet A1 is 150, and you change it to 200, you are modifying the data.
- If you create a formula in A2 by using the data present in A1, it results in data manipulation if you store the result in A2.
- If you write a macro to pick up the value in A1, run a calculation in the background, and save the result in A1, you are doing both data manipulation and modification.
Advantages of Data Manipulation
It is crucial for data analytics. Here are some benefits of data management.
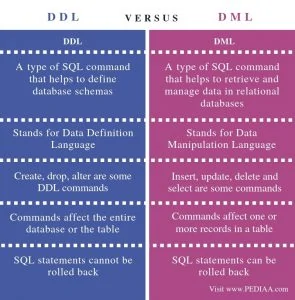
– Data Manipulation Language statements can modify the data stored in a database.
– The user can specify which data is needed and which is not.
– The language has different flavors and capabilities between database vendors.
– It enables humans to interact with the system with ease.
Demerits of Data Manipulation
Just as it has advantages, it has some drawbacks as well.
– One cannot use data manipulation language to change the database structure.
– It is not possible to create or delete tables and columns using the language.
Final thoughts
Data in its unstructured form is not easily decipherable. It can have excellent content, but it is of no use if you cannot extract the required information from it. It allows you to sort the vast quantities of data and present it in a form that can be convenient to understand. It has paramount significance in data analytics today because data is the cornerstone of every industry.
Though the word ‘data manipulation’ conveys a negative feeling, it is not so because the user can use data manipulation techniques to glean different kinds of information from it. Data manipulations end up providing value to your data. It also helps businesses to use historical data and devise new strategies to improve the overall functioning of the company.
Are you inspired by the opportunity of Data Science and Analytics? Data Science is a vast and varied field, and though new, it has been adopted by many top organizations across the globe. Enroll in Digital Vidya’s Data Science Course to create a strong foundation in Data Science & build a successful career as a Data Scientist.