Graphical tastefulness is seldom found amidst complex data and simplified design. The importance of Data Visualization cannot go unnoticed in this.
An elegant presentation of data makes it easier to perceive and explain; that’s how human brains are wired. Data visualization means what it sounds like.
Encompassing all the visual aspects of a data science course means beautifying the information (data) by placing it into visually appealing formats such as maps, graphs, pie-charts, etc.
What is Data Visualization?
Data visualization is one of the key aspects of Data analysis but is much more than just a mere part of it, thus stressing data’s visual aspects.
The presence of a humongous amount of data can turn out to be a great asset, as well as a huge liability at the same time. Thus, this is where the importance of Data visualization comes to the forefront. Sometimes, a huge ocean of data can lead to a total inability to reach a decision.
Such overwhelming volumes of data might end up defying its purpose of measuring performance. Here is where Data Visualization comes into the picture, forming the most crucial aspect of data science courses.
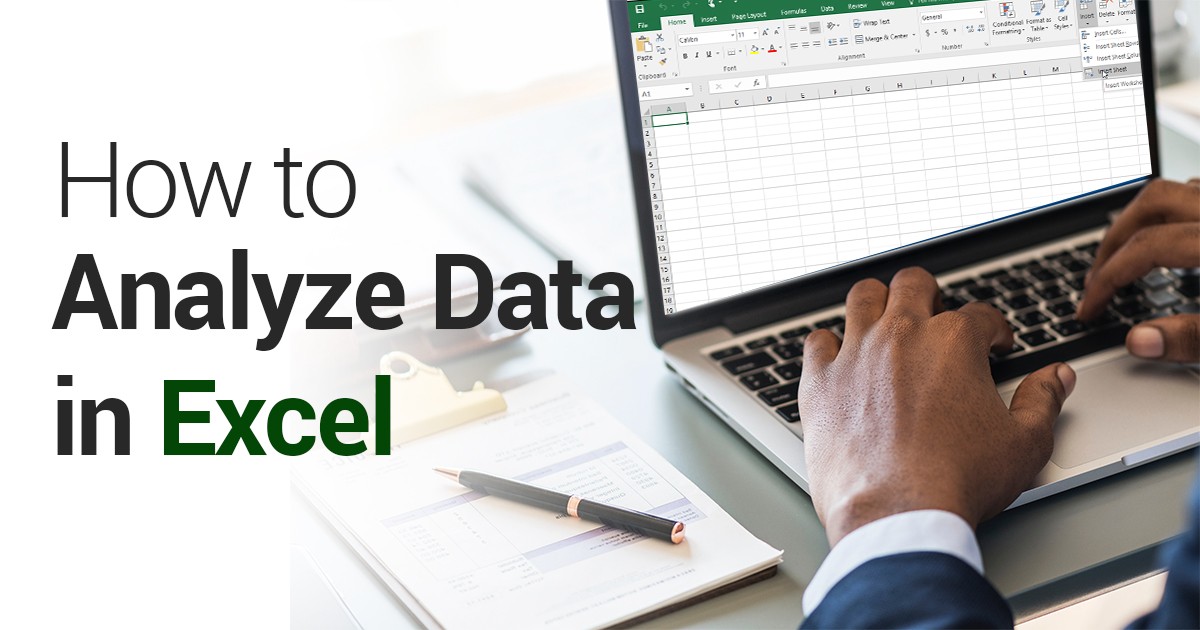
The most common way to create data visualizations these days is to draw all the data from the excel sheet and conveniently transform it into a bar graph, pie chart, or simply a table. The importance of data visualization is realized when analysis becomes a whole lot easier using the graphics rather than large files.
There are also options to create more intricate, animated visuals to indulge in detailed data analysis.
Types of Data Visualization
After understanding what data visualization is, it is important to know the different visuals types to fit them into their uses aptly. There are currently multiple tools to help individuals to create attractive and detailed data visuals. Some of the tools are manual, whereas some of them are automated in their application. In the end, any efficient data science course shall help produce any of the following visuals.
1) Line chart
A line chart is a visual that changes over time with the change in the dataset. The two axes, x, and y, the former is a period, and the latter is quantity. It shall mean that if a company’s sales are on the x-axis, sales by month and units produced each day can be represented.
2) Area chart
The area is an improved adaptation of a line chart where the area under the line is filled. This shows its emphasis and helps understand the data better. The Colour fill under the line should be transparent, so there is no overlapping.
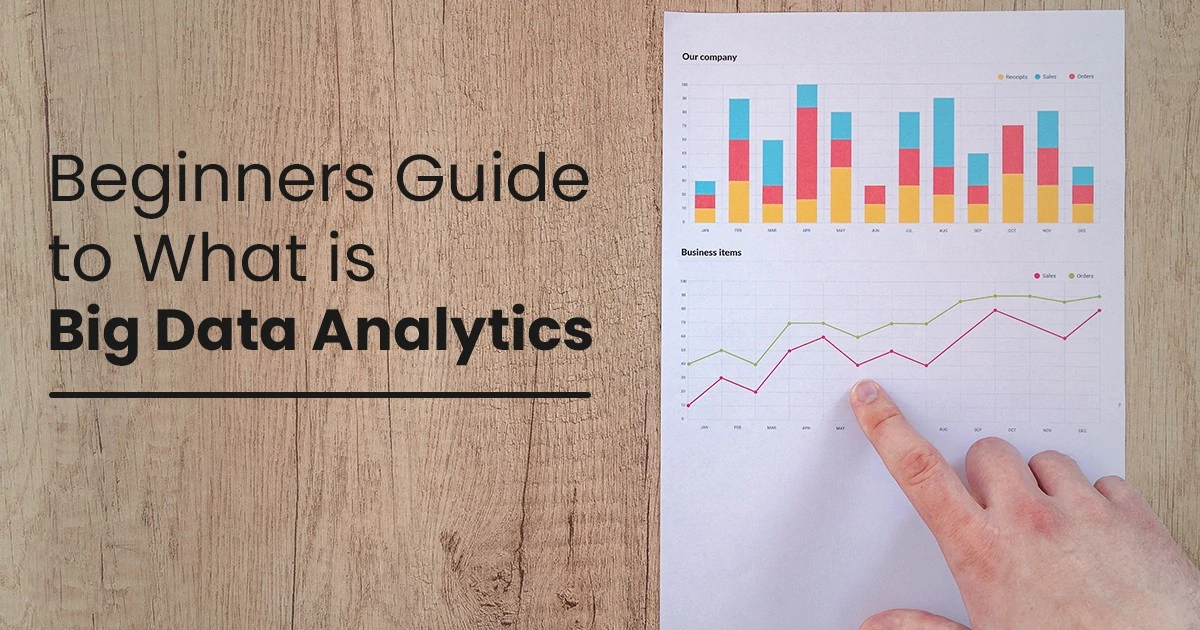
3) Bar chart
The bar chart shows the changes in the trend over time. In case there is more than one variable, it makes analysis easier to compare data from time to time. It can help compare a company’s sales from one year to another.
Importance of Data Visualization
The world is inherently visual today. The words and data speak larger than words.
The importance of data visualization cannot be undermined in this scenario. It is especially significant when it comes to big data analysis as well as project analysis. It helps organizations communicate their data with the help of images. Thus, in this way, data visualization is important to trace the trends and patterns and make them more visually accessible.
The use of machine learning is growing significantly in organizations today. Dealing with large amounts of data can get a little messy, and thus the importance of data visualization cannot be undermined.
All the good data science courses cater to these requirements of providing comprehensive knowledge on all the visual tools used to analyze and present data.
- With the advent of big data, it is a lot easier to conduct analysis and make predictions. While the visuals have come to the rescue of the data scientists, they also pave the way for sorting things efficiently and quickly. It helps to comprehend and make sense of the data to the people running the business and the other stakeholders. Thus, all the upcoming data science courses are bliss to data science.
- Similar is the case with advanced analysis of the projects too. When the data scientists are working on complex projects that require extensive data analysis, the importance of data visualization kicks in. The humongous data that is collected can be assembled in the form of visuals and analyzed simultaneously. It helps ensure that the analytical tools are behaving the way they should.
- The impression, though, that the importance of data visualization is restricted to the data scientists is false. In any career that needs to work around the analysis of growth, business trends, and big data, visual data comes to the rescue.
The following points shall trace the nuances of why data visualization is important. This can be a beautiful guide to everyone who wishes to seek the help of these creative tools.
- Dispenses Better Insights
- Smoothens Decision-Making Process
- Makes Huge Chunks of Data Comprehensible
- Helps in Identifying Patterns and Preventing Errors
- Facilitates Prompt Action and Better Analysis
The business organizations and the stakeholders can understand the nuances of the company better with visual data. The importance of data visualization as a discipline has crept in to highlight a lot of data science courses.
Reasons to choose Data Visualization
Based on the analysis, these strategies can help focus on the key areas that affect the company’s numbers. These can be sales, marketing strategies, as well as other product-based decisions.
They can also help focus on the sector that requires attention to make it more productive.
1) Quick action plan
It is no rocket science that a mind grasps visual information better and quicker than a tabular report or a sheet full of numbers. Data visualizations are important here as it allows the people who hold a stake in the organization to be better notified and take actions immediately based on new data insights. The business growth will be inclusive if the data outreach is quicker and better.
2) Ease in Identification of Patterns
A large amount of data, seemingly complex, can have a lot of potential in providing rich insights into the business. Thus, the importance of data visualization neutralizes the complications in data and helps to assemble it creatively. Working around these patterns, the stakeholders can focus on areas that demand attention to take huge leaps in business ahead.
3) Easy in Spotting Errors
An excel sheet of humongous data is far more complex when identifying errors than a graphic. If the tabular version suggests some anomalies, visual data makes it easy to find and scrap it.
4) Understanding the Story
The purpose of presenting data in the form of a dashboard is to tell a story, starting from history to futuristic trends. With a meaningful presentation, the whole picture shall be clear to the eyes in one single glance. Detailed visuals can also be created to present complex figures in the form of a graph. The data science courses today serve this purpose.
Providing Rich Insights into Business
The market is a competitive war zone. It is difficult to be up-to-date with the data that is processed daily. The significance of having meaningful insights into the producer-consumer relations with the help of data analysis cannot be ignored. These insights are a result of the key aspects of important data visuals. They help set the path towards the larger goal of the organization.
Best Data Visualization Tools
Data visualization tools are quite significant in the Software Testing world, as they offer the easiest and most powerful ways to design and analyze the visual representation of data.
In this section, we cover a list of some of the most useful free and commercial Data Visualization Tools. So, let us get started right away-
- Xplenty
- HubSpot
- Whatagraph
- Tableau Desktop
- Sisence
- Adaptive Discovery
- TeamMate Analytics
- JupyteR
- Dundas BI
- Infogram
- Google Charts
- Visme
- Domo
- Cluvio
- TapClicks
Wrapping up!
On the concluding note, it is evident that data visuals can set your organization’s growth in a quick motion, as it involves efficient data analysis methods. The latest trends in the market can be identified and implied to one’s own business with data visualization.
Upping your game to stay in touch with the trends helps the stakeholders, reinforcing the importance of data visualization.
While dealing with huge data, the role of data visualization becomes highly prominent for assisting people in understanding the significance of data with the help of some visual aids such as patterns, dashboards, trends, charts, etc.
To learn and master the concepts of data visualization, enrol yourself in a Data Science Course.
Still, having any doubts about the role of data visualization in optimizing the growth of your data science career? Then feel free to ask your queries to our experts in the comment section below.