Any student pursuing Data Analysis or Data Science will tell you that one should have proficiency in Python to understand the subtler aspects of the subject. Python offers powerful, expressive, and flexible data structures to make data manipulation and analysis easy. DataFrames in Python are one of such data structures. Here, we will learn how Dataframes in Python work.
Let us learn how to:
- Create a Pandas DataFrame
- Select Index or Column from a DataFrame
- Add Index, Row, or Column to a DataFrame
- Delete Index, Row, or Column from a DataFrame
- Rename Column or Index of a DataFrame
- Format Data in your DataFrame
- Create an empty DataFrame
- Reshape your DataFrame
- Iterate over a DataFrame
- Write a DataFrame to a file
Before we proceed to the details, let us understand the concept of DataFrames.
The Python Pandas DataFrames
If you are familiar with R, you would know data frame as a method for storing data in rectangular grids for easy overviewing. The rows in the grid correspond to measurements or values of an instant whereas the columns represent vectors containing data for a specific variable. Thus, a data frame’s rows can include values like numeric, character, logical, and so on. The DataFrame in Python is similar in many ways. They are two-dimensional labeled data structures having different types of columns.
You can now say that the Python Pandas DataFrame consists of three principal components, the data, index, and the columns.
Create a DataFrame
Creating a DataFrames in Python is the first step when it comes to data management in Python. You can create a Dataframes in Python from different inputs like-
- Lists
- Dict
- Series
- Numpy ndarrays
- Another DataFrame
- External files such as CSV
Creating a DataFrame in Python from a list is the easiest of tasks to do. Here is a simple example.
import pandas as pd
data = [1,2,3,4,5]
df = pd.DataFrame(data)
print df
This is how the output would look like.
You can also add other qualifying data by varying the parameter. Accordingly, you get the output. Similarly, you create DataFrame in Python from ‘Dictionary, Dictionary of Series, Dictionary of ndarrays, and so on.
Let us look at another example of creating a DataFrame from a NumPy array.
data = np.array([[‘ ‘, ‘Col1’, ‘Col2’], [‘Row1’ , 1,2], [‘Row2’, 3,4]])
print(pd.DataFrame(data=data[1:,1:], index=data[1:,0], columns=data[0,1:]))
Note that you select the values in the lists starting with Row1 and Row2 before selecting the index Row1 and Row2 and then the column names Col1 and Col2.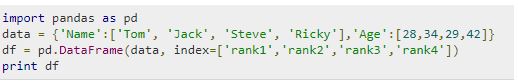
The output would be as follows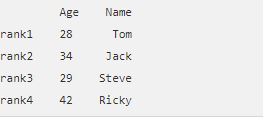
)
In the above example, the first step is to create a DataFrame for importing.
Save the DataFrame as csv in the working director
df.to_csv(‘pandas_dataframe_importing_csv/example.csv’)
Load a csv
df = pd.read_csv(‘pandas_dataframe_importing_csv/example.csv’)
df
This is what you get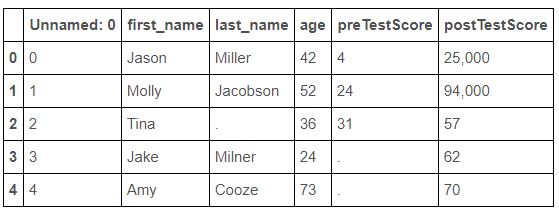
Similarly, you can do a variety of tasks like loading a csv with no headers, csv while specifying column names, and so on.
Select an Index or Column from the DataFrame
Now that you know how to create a DataFrame, we shall now proceed to know how to select an index or column from it. Selecting a component from the Python DataFrame is important before learning how to add, delete, or rename it.
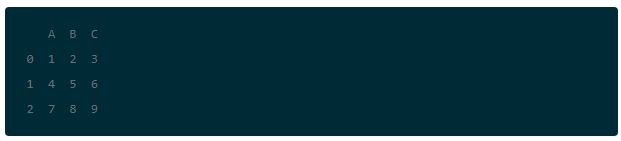
Assume the dataframe like written in the example above.
You wish to access the value at Index 0 for column A. You can do so by using a variety of options.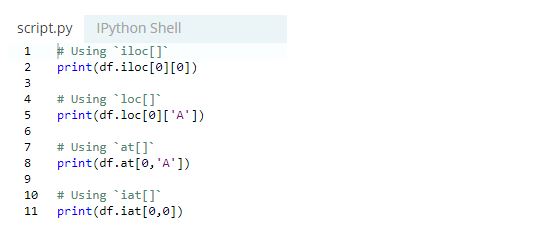
In case you wish to select the rows or the columns, you have to follow the procedure listed below.
Selection by Label – You can select rows by passing row label to a loc function
The output would be as follows-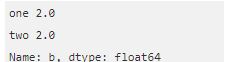
Selection by Integer Location
You can also select row bypassing integer location to an iloc function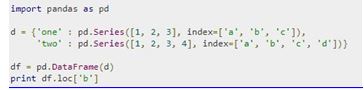
The output would look like this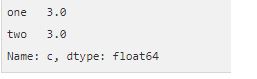
(A brief para on loc and iloc would be needed here.)
Let us now see the concept of loc and iloc for a better understanding
The major difference between a loc and iloc function is in its indexing attributes.
.loc works on your index labels. Therefore, if you give in loc[2], you have to look for the values of your DataFrame having index labeled 2.
.iloc works on the position of your index. Therefore, you have to look for the values of your DataFrame that are at index ‘2’
Add Index, Row, or Column
Index
Whenever you create a DataFrame in Python, you could add the input to the ‘index’ argument to ensure that you get the index you desire. If you do not specify anything, DataFrame will, by default, have a numerically valued index starting from 0. You can still re-use any of the columns and make it your index by calling set_index( ) on your DataFrame.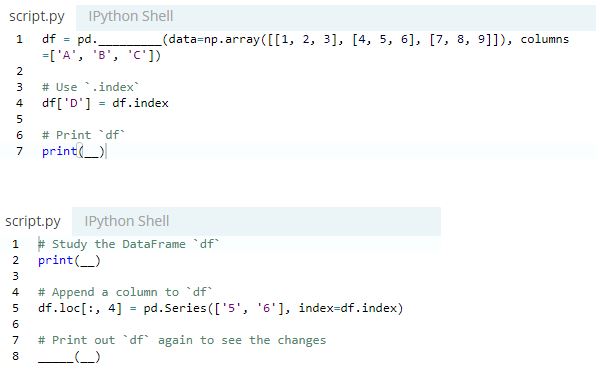
Rows
Before we go into the aspect of adding rows or columns to a DataFrame, it is better to understand the concept of loc and how it differs from .iloc[ ].
- loc – If you give in loc[2], it means that you look for values of your DataFrame having index labeled as 2.
- .iloc[2] – Under such circumstances, you look for values of your DataFrame that are at index ‘2’.
It is a subtle difference, but important all the same.
The general recommendation is that you use .loc to insert rows in your DataFrame. This example will clear things for you.
Columns
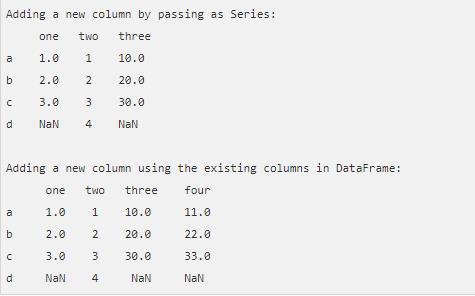
You can add columns to your DataFrame in the same way you add rows. Let us look at the simple example below.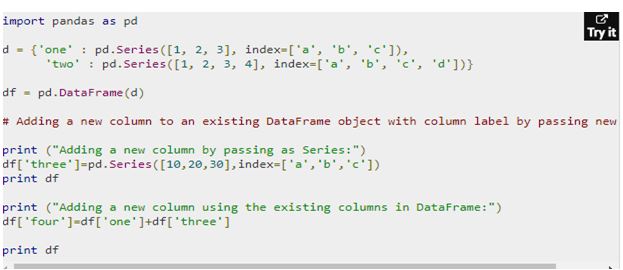
You get the output in the following manner.
Delete Index, Row, or Column from a DataFrame
In the previous paragraph, we had seen how to add indices, rows, or columns to your DataFrame. Now, we shall look at how to delete them.
Index
You should think twice before deleting an index from the Python DataFrame in because every DataFrame has an index.
Reset the Index of your DataFrame
If you do not like the way your index look, you can reset it using the .reset_index( ) command.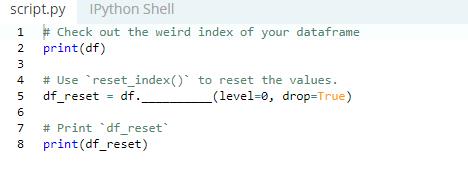
Why do you use the word ‘drop’ instead of ‘inplace’ here? It is because using the ‘drop’ argument will help you get rid of the existing index whereas ‘inplace’ will add the original index with floats as an extra column to your DataFrame in Python.
You can
- Reset the index as described in the previous paragraph
- Remove the index name by executing del df .index.name,
- Rectify the duplicate values by resetting the index and dropping the duplicate items, and reinstating the columns again as index.
Column
You can use the drop( ) method to delete columns. You can also set inplace to True to delete the column without reassigning the Python Frame.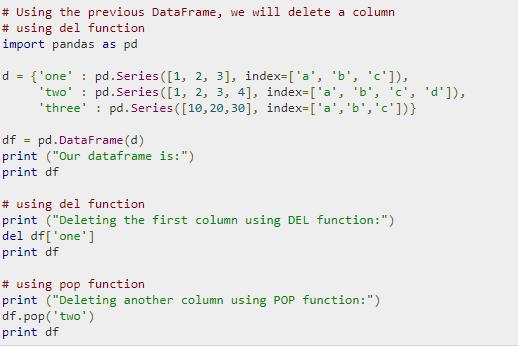
This is how the output would look like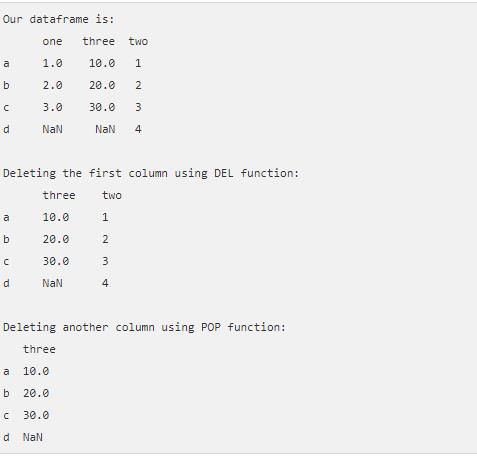
Row
The method to remove duplicate rows from your DataFrame is to execute df .drop_duplicates( ). If there are no duplicates, you can use the drop( ) method to remove the rows from your DataFrame.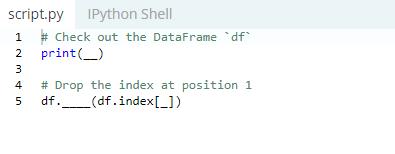
Rename Index or Columns of a Pandas DataFrame
The best way to rename an index or column is to use the .rename( ) method.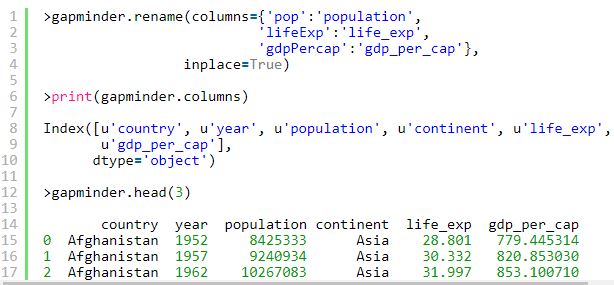
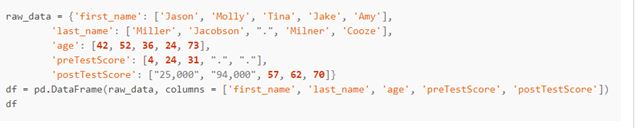
Format Data in your DataFrame
Ø Replace all occurrences of a string
Use the replace( ) command to replace specific strings in your DataFrame.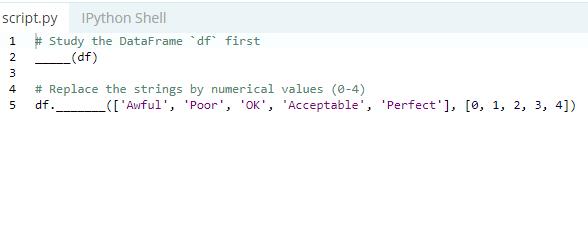
Ø Removing parts of strings in your Cells
Now, it is not difficult to remove unwanted strings in your Cells.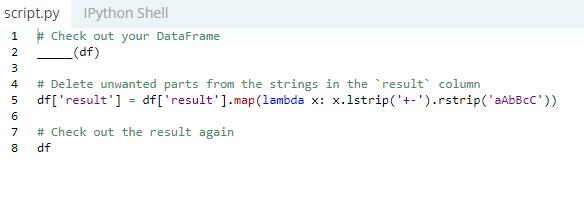
Use map( ) on the column result for applying the lambda function over each element you wish to delete.
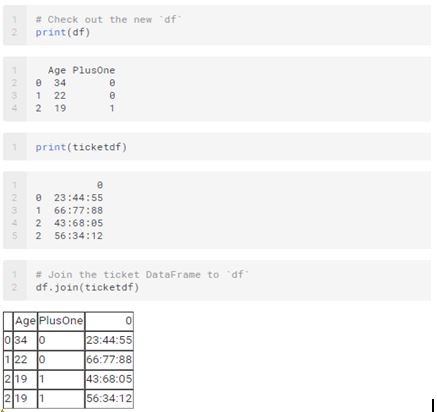
Ø Splitting a Text in a Column into Multiple Rows in a DataFrame
This task is a challenging one. Here is the method for you.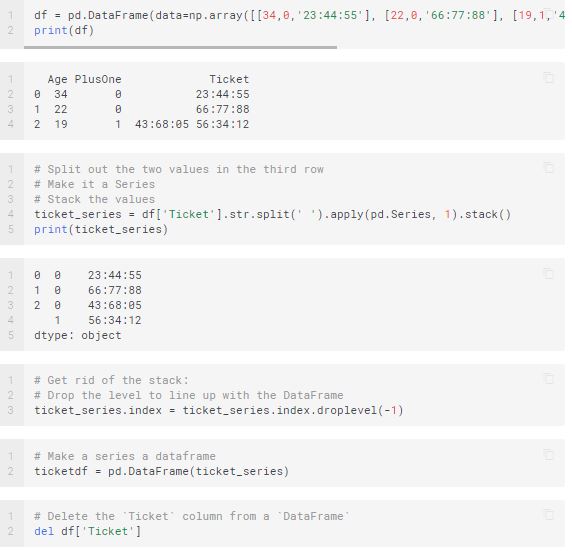
Create empty DataFrames in Python
You can create an empty DataFrame and subsequently add data to it.
Creating an empty DataFrame in Python is the easiest of all operations. Here is the example and the output.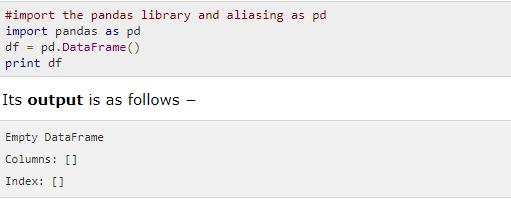
Reshape your DataFrames in Python
At times, you might not be able to use the DataFrame in its present form as it would not be suitable for data analysis. Hence, you might have to reshape your DataFrames. It is not about formatting the data but transforming the shape of the DataFrame. It brings us to the question of how should you reshape your DataFrame.
There are three methods of reshaping your DataFrames.
Pivoting
Use the pivot( ) function for creating a new derived table from your original one. You have to take care of these factors.
- Values – This argument enables you to specify which values of the original you wish to have in your pivot table
- Columns – The data you pass on to this argument will end up a column in your resulting table.
- Index – Similarly, whatever you pass on to this argument becomes an index in your new table.
Here is an example of the pivot function.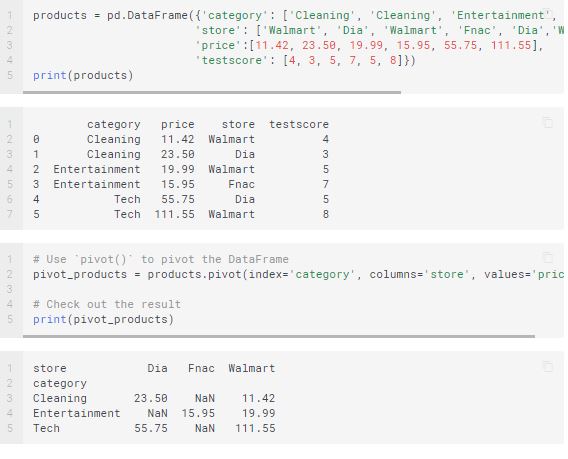
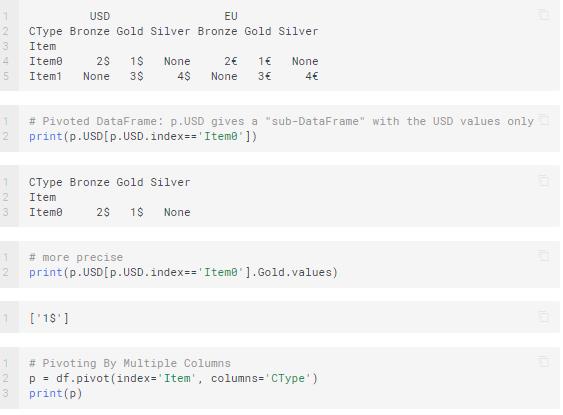
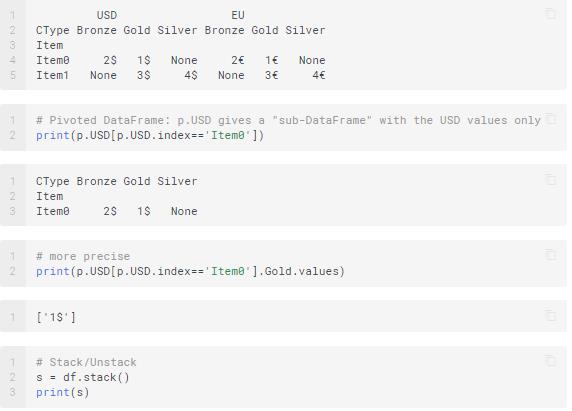
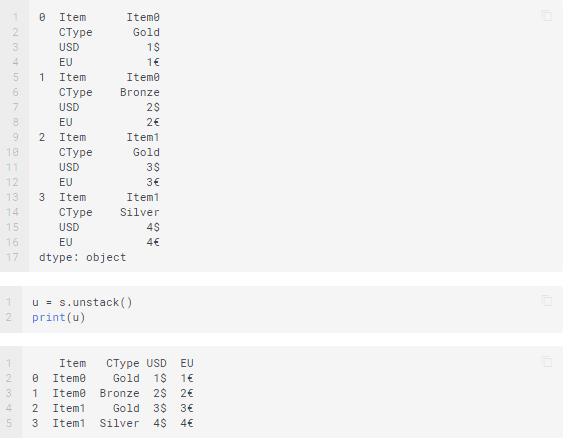
Stacking and Un-stacking
When you stack your DataFrame in Python, you make it look taller. In this method, you move the innermost column index to become the innermost row index. Thus, you end up with a DataFrame having a new inner-most level of row labels.
Un-stacking is the opposite of what you do in stacking. Here, you move the innermost row index to become the innermost column index.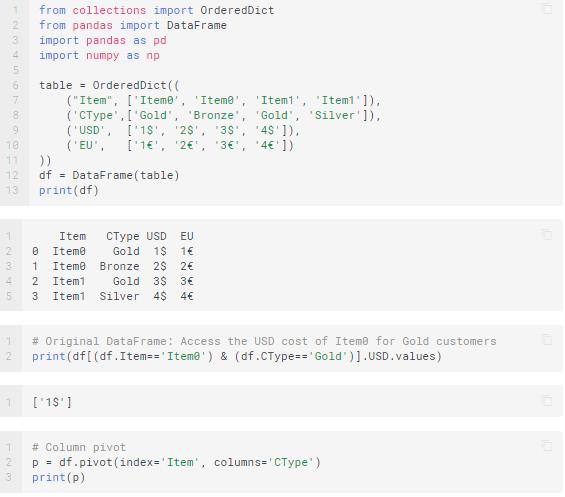
Melting
Melting is useful when you have data with one or more columns as identifier variables whereas the other columns are measured variables. You pivot the measured variables to the row axis. Now, you have the measured variables spread out over the width of the DataFrame. The melting function ensures that your DataFrame becomes longer instead of becoming wider.
Hence, you have two non-identifier columns, namely ‘variable’ and ‘value.’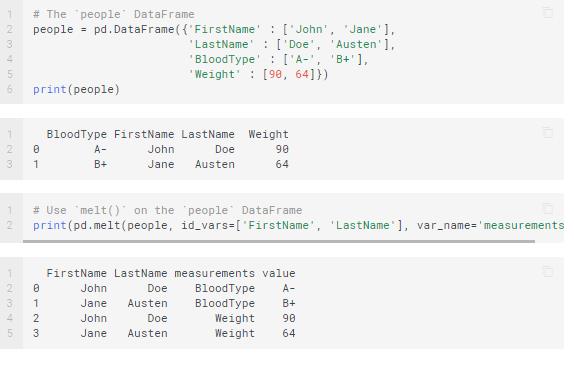
Iterate over DataFrames in Python
Using the ‘for’ loop in combination with an iterrows( ) call on your DataFrame can help you iterate over the rows of your DataFrames in Python.
The iterrows( ) function allows you to loop over your DataFrame rows as pairs.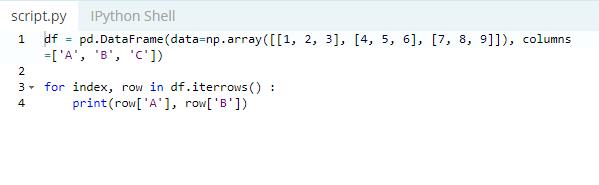
Write DataFrames in Python to a file
Now that your data manipulation and munging is over, you need to export the DataFrames in Python to another format. You can do so to a CSV file or an MS Excel file.
Ø To CSV File
Use the function to_csv( ) to write a DataFrame as a CSV file.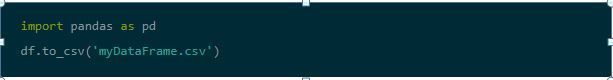
Ø To Excel File
Similarly, using the to-excel( ) function, you can write your DataFrames in Python to MS Excel. However, the process is a complicated one in comparison.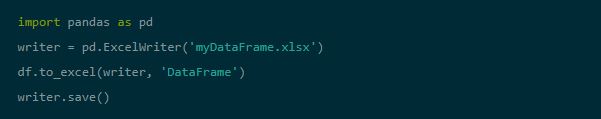
Conclusion
Data science as a career option is fast gaining prominence. Taking up a good Data Science course teaches you the key Data Science skills and helps you to become a Data Scientist.
We have seen a few most used concept of DataFrame in Python in this blog. It should be useful for all Data Science students. Happy Studying!!


Very Well explained, Crisp and exact content which I was looking for
ThankYou!