K means clustering algorithm
K means clustering is an unsupervised machine learning algorithm. An unsupervised learning algorithm is applied to unlabeled data(data without defined categories or groups). The purpose of this algorithm is to find clusters(groups) in the data with the number of clusters being equal to K.
The K means clustering works by randomly initializing ‘k’ cluster centers from all the data points.
If we have m training examples in our data set, (x(1), x(2),……….., x(m)), then randomly initialize k cluster centroids choosing any k points from m points.
Cluster centers:- (μ(1), μ(2),……….., μ(K))
Then, the algorithm iterates between these two steps –
1. Cluster Assignment Step
It finds the distance of each point from all of these K clusters and assigns to each point a number which corresponds to the cluster which has the minimum distance from that point
for i = 1 to m
{
assign c(i) as index(1 to K) of cluster center closest to x(i)
}
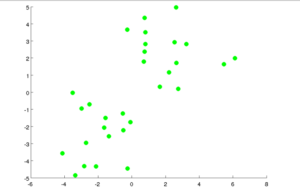
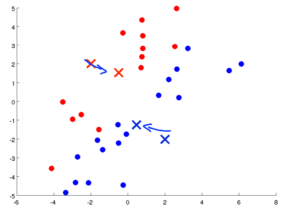
Say, you have the following set of points.
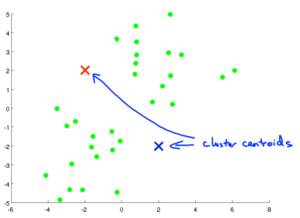
Randomly, two cluster centroids, as K=2 are assigned.
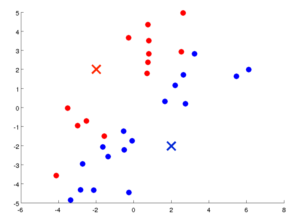
The distance of the points from cluster centroids are determined and each point is assigned to one of the two clusters(red or blue).
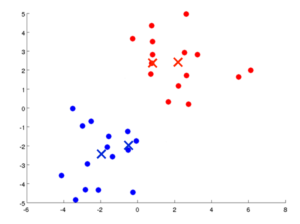
2. Update Cluster Centers Step
In this step,the cluster centers of each cluster are updated by taking the mean of all the points assigned to that cluster.
for k = 1 to K
{
assign μ(k) as the mean of all data points assigned to μ(k)
}
The mean of the points in a cluster center is calculated and the centroids are shifted to a new value.
The above two steps are performed repeatedly for a set number of iterations.
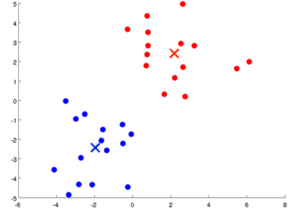
The algorithm iterates between steps and stops when no data points change clusters, the sum of the distances is minimized, or some maximum number of iterations is reached. The algorithm will always converge but sometimes a local minimum is reached and the best results are not obtained due to poor initialization. Hence it is recommended to run the algorithm several times with different random initializations.
Choosing K
To find the number of clusters in the data, the user needs to run the K-means clustering algorithm for a range of K values and compare the results. In general, there is no method for determining the exact value of K, but an accurate estimate may be obtained by using the Elbow method.
In the elbow method, values of K are tried starting from 1 and the cost function which is the sum of distances between points and their cluster centers is plotted. As the value of K increases, this cost will always decrease which means that when K is very high this cost will be minimum but choosing the maximum K defeats the purpose of clustering. Instead, K is chosen at the point where this cost decreases sharply also known as the ‘elbow point’.
Another way of choosing K is according to your purpose or what you expect your data to show you. For example, in a problem where we have a data set of different T-shirts, we can choose K=3 for small, medium and large-sized T-shirts.
Application of K Means Clustering
One of the most interesting applications of K means clustering is compressing images. In a colored image, each pixel is a combination of 3 bytes (RGB), where each color can have intensity values from 0 to 255. Therefore, the total number of colors which can exist in an image is 256 x 256 x 256, which is almost 16.7 million. Practically, only a fraction of those colors exist in an image that contributes to the size of it.
The K- means clustering works by randomly initialisinsg k-cluster centers from all the data points. Then in every iteration, it proceeds to find the distance of each point from the cluster centers and assigns each point the coordinate of the cluster center which is nearest to it. After all points have been assigned to the cluster, it takes the mean of the points in every cluster and sets it as the new cluster center. It keeps on doing this for a specified number of iterations.
In an image, there are many different colors and hence many different RGB pixel combinations. If we apply K-means and assign each pixel the RGB values of its assigned cluster center, we can reduce the number of RGB combinations or in other words reduce the number of colors in the image, thereby compressing it and reducing its size.
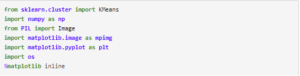
Let us start by importing all the required libraries. sklearn library provides us with the KMeans implementation class and PIL is an image processing library, which is used here to obtain the pixel values from the image. Matplotlib is also used to plot the original and compressed images and finally, os is used to find the size in bits of the images.
We open the image using PIL and get the RGB pixel values.
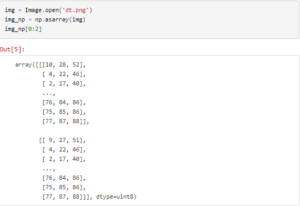
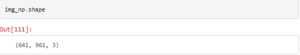
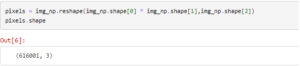
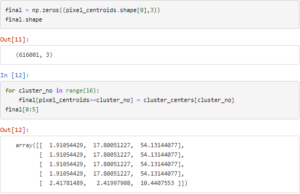
The dimensions of the image are 641 X 961 pixels with each pixel having 3 values(RGB). For feeding the data into our algorithm we will change the shape of this data into a dataset with 641*961=616001 rows and 3 columns.
We define the kmeans model with the number of clusters =16 i.e. k=16. This means that we want to keep just 16 colors in our compressed image. You can play around with this keeping in mind that the lesser the number of clusters the more compressed will the image be but the quality of the image will also decrease.
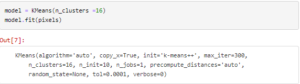
The rest of the parameters of the model such as the number of iterations are 300. n_init=10 implies that it will randomly initialize the clusters 10 times, run the algorithm each time and display the best result. It is useful to initialize the clusters more than once as a bad random initialization may cause the algorithm to be stuck and assign the clusters improperly.
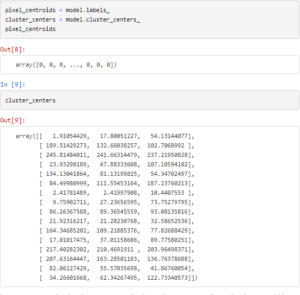
After the model is trained we use model.labels_ to obtain the number of cluster that is assigned to each data point or each pixel. model.cluster_centers_ gives us the coordinates or the RGB values of the 16 cluster centers.
Now we want to assign the cluster centers to the data points corresponding to the cluster to which they belong. We take a matrix of shape (616001,3) corresponding to the pixels and initialise it with zeros. We then iterate through all the clusters and assign the cluster centroids (RGB values) to each data point, thereby reducing our image into 16 colors.
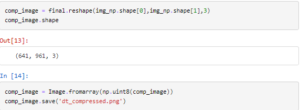
After we have obtained our compressed image in pixel values we reshape it to the original dimensions, convert the pixel values into an image and save it.
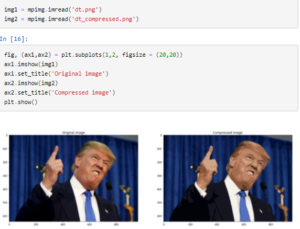
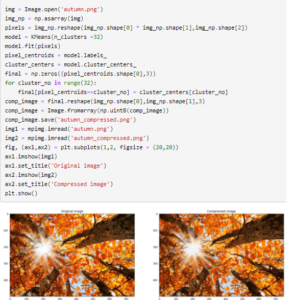
We use matplotlib to plot the original and compressed images
Let us now compare the size of the original and compressed images.
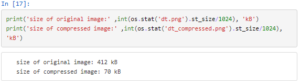
As you can see, we get a almost a 6 times reduction in the size keeping most of the features of the image intact. Let us try this with another image, this time choosing 32 clusters.
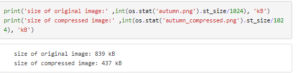
This time we took 32 colors and reduced the size by half. We can see that we get a much better quality image now.
That is all about using clustering and its application to compress an image. Any questions and suggestions are welcome in the comments.
Photo credits: self