
“We should seek the greatest value of our action.”- Stephen Hawking
Outlier detection from a collection of patterns is an active area for research in data set mining. There are several modelling techniques which are resistant to outliers or may bring down the impact of them. Outlier detection and understanding them can lead to interesting findings.
Definition of Outlier Detection
Outliers are generally defined as samples that are exceptionally far from the mainstream of data. There is no rigid mathematical definition of what constitutes an outlier; determining whether or not an observation is an outlier is ultimately a subjective exercise.
An outlier may also be explained as a piece of data or observation that deviates drastically from the given norm or average of the data set. An outlier may be caused simply by chance, but it may also indicate measurement error or that the given data set has a heavy-tailed distribution.
Therefore, Outlier Detection may be defined as the process of detecting and subsequently excluding outliers from a given set of data. There are no standardized Outlier identification methods as these are largely dependent upon the data set. Outlier Detection as a branch of data mining has many applications in data stream analysis.
Download Detailed Brochure and Get Complimentary access to Live Online Demo Class with Industry Expert.
This paper focuses on the problems of detecting outlier over data stream and the specific techniques used for detecting outlier over streaming data in data mining. We would also focus on outlier detection methods and recent researches on outlier analysis.
Our discussion will also cover areas of standard applications of Outlier Detection, such as Fraud detection, public health, and sports and touch upon the various approaches like Proximity-based approaches and Angle-based approaches.

Outlier Detection Techniques
For outlier identification in a dataset, it is very important to keep in mind the context and finding answer the very basic and pertinent question: “Why do I want to detect outliers?” The context will explain the meaning of your findings.
Remember two important questions about your dataset in times of outlier identification:
(i) Which and how many features am I considering for outlier detection? (univariate / multivariate)
(ii) Can I assume a distribution(s) of values for my selected features? (parametric / non-parametric)
There are four Outlier Detection techniques in general.
1. Numeric Outlier
Numeric Outlier is the simplest, nonparametric outlier detection technique in a one-dimensional feature space. The outliers are calculated by means of the IQR (InterQuartile Range). For example, the first and the third quartile (Q1, Q3) are calculated. An outlier is then a data point xi that lies outside the interquartile range.
Using the interquartile multiplier value k=1.5, the range limits are the typical upper and lower whiskers of a box plot.
This technique can easily be implemented in KNIME Analytics Platform using the Numeric Outliers node.
2. Z-Score
Z-score technique assumes a Gaussian distribution of the data. The outliers are the data points that are in the tails of the distribution and therefore far from the mean.

After making the appropriate transformations to the selected feature space of the dataset, the z-score of any data point can be calculated with the following expression:
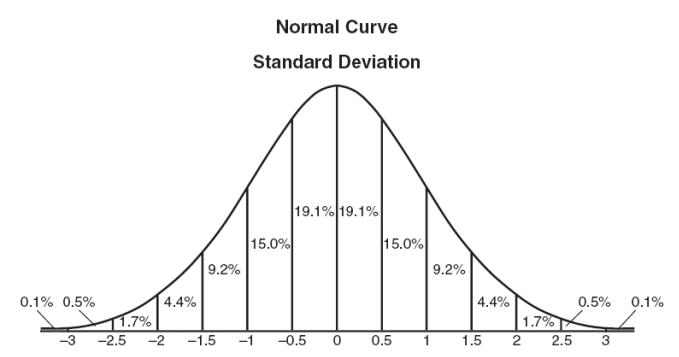
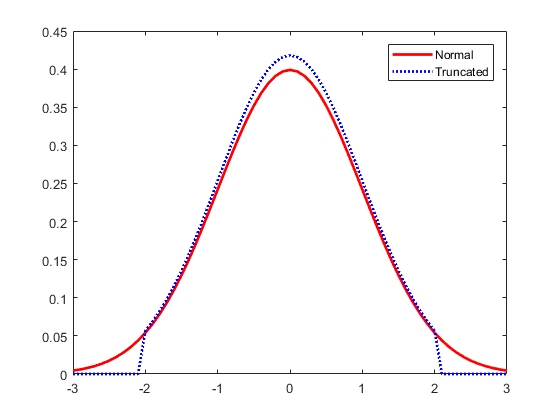
When computing the z-score for each sample on the data set a threshold must be specified. Some good ‘thumb-rule’ thresholds can be 2.5, 3, 3.5 or more standard deviations.
3. DBSCAN
This Outlier Detection technique is based on the DBSCAN clustering method. DBSCAN is a nonparametric, density-based outlier detection method in a one or multi-dimensional feature space. Here, all data points are defined either as Core Points, Border Points or Noise Points.
To put it in simpler words, Core Points are data points that have at least MinPts neighbouring data points within a distance ε.
Border Points are neighbours of a Core Point within the distance ε but with less than MinPts neighbours within the distance ε. All other data points are Noise Points, also identified as outliers. Outlier detection thus depends on the required number of neighbours MinPts, the distance ε and the selected distance measure, like Euclidean or Manhattan.
4. Isolation Forest
This nonparametric method is ideal for large datasets in a one or multi-dimensional feature space. The isolation number is of paramount importance in this Outlier Detection technique. The isolation number is the number of splits needed to isolate a data point. This number of splits is ascertained by following these steps:
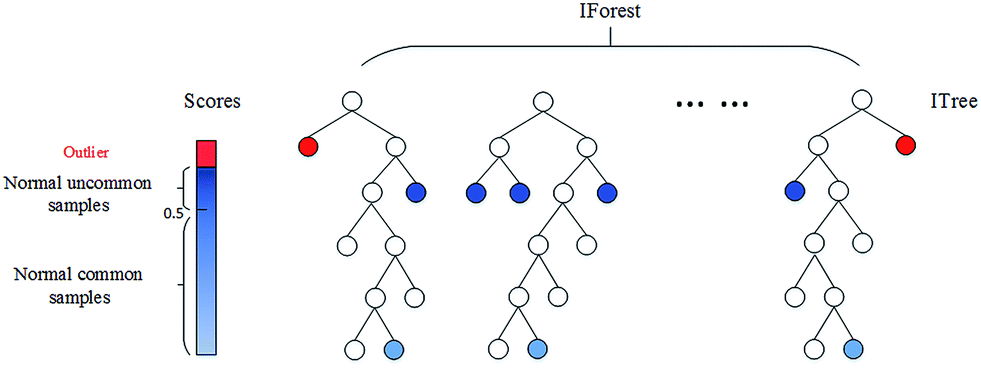
It requires fewer splits to isolate an outlier than it does to isolate a nonoutlier, i.e. an outlier has a lower isolation number in comparison to a nonoutlier point. A data point is therefore defined as an outlier if its isolation number is lower than the threshold.
The threshold is defined based on the estimated percentage of outliers in the data, which is the starting point of this outlier detection algorithm. Isolation Forest technique was implemented using the KNIME Python Integration and the isolation forest algorithm in the Python sklearn library.
The aforementioned Outlier Techniques are the numeric outlier, z-score, DBSCAN and isolation forest methods. Some may work for one-dimensional feature spaces, while others may work well for low dimensional spaces, and some extend to high dimensional spaces.
Some of the techniques may require normalization and a Gaussian distribution of the inspected dimension. Again, some Outlier Techniques require a distance measure, and some the calculation of mean and standard deviation.
Outlier Detection Methods
Models for Outlier Detection Analysis
There are several approaches to detecting Outliers. Outlier detection models may be classified into the following groups:
1. Extreme Value Analysis
Extreme Value Analysis is the most basic form of outlier detection and great for 1-dimension data. In this Outlier analysis approach, it is assumed that values which are too large or too small are outliers. Z-test and Student’s t-test are classic examples.
These are good heuristics for initial analysis of data but they do not have much value in multivariate settings. Extreme Value Analysis is largely used as final step for interpreting outputs of other outlier detection methods.
2. Linear Models
In this approach, the data is modelled into a lower-dimensional sub-space with the use of linear correlations. Then the distance of each data point to a plane that fits the sub-space is being calculated. This distance is used to find outliers. PCA (Principal Component Analysis) is an example of linear models for anomaly detection.
3. Probabilistic and Statistical Models
In this approach, Probabilistic and Statistical Models assume specific distributions for data. They make use of the expectation-maximization (EM) methods to estimate the parameters of the model. Finally, they calculate the probability of membership of each data point to calculated distribution. The points with a low probability of membership are marked as outliers.
4. Proximity-based Models
In this method, outliers are modelled as points isolated from the rest of the observations. Cluster analysis, density-based analysis, and nearest neighborhood are the principal approaches of this kind.
5. Information-Theoretic Models
In this method, the outliers increase the minimum code length to describe a data set.
Outlier Detection Methods In Use
1. High Dimensional Outlier Detection
Real-world data sets are mostly very high dimensional. In many applications, data sets may contain thousands of features. The traditional outlier detection approaches such as PCA and LOF will not be effective. High Contrast Subspaces for Density-Based Outlier Ranking (HiCS) method explained in this paper as an effective method to find outliers in high dimensional data sets.
LOF method discussed in the previous section uses all features available in data set to calculate the nearest neighborhood of each data point, the density of each cluster and finally outlier score for each data point.
In other words, the contrast in distances to different data points becomes nonexistent. This basically means using methods such as LOF, which are based on the nearest neighborhood, for high dimensional data sets will lead to outlier scores which are close to each other.
2. Proximity Method
Once you have explored the simpler extreme value methods, consider moving onto proximity-based methods.
(i) Use clustering methods to identify the natural clusters in the data (such as the k-means algorithm).
(ii) Identify and mark the cluster centroids.
(iii) Identify data instances that are a fixed distance or percentage distance from cluster centroids.
(iv) Filter out the outliers candidate from training dataset and assess the model’s performance.
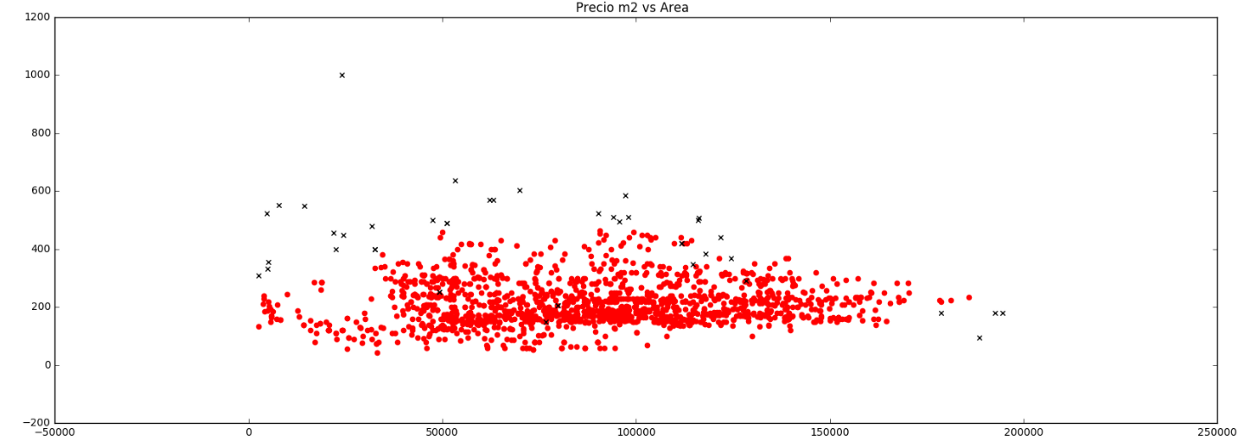
3. Projection Method
Projection methods are relatively simple to apply and quickly highlight extraneous values.
(i) Use projection methods to summarize your data to two dimensions (such as PCA, SOM or Sammon’s mapping).
(ii) Visualize the mapping and identify outliers by hand.
(iii) Use proximity measures from projected values or codebook vectors to identify outliers.
(iv) Filter out the outliers candidate from training dataset and assess the model’s performance.

Outlier Detection Applications
Outlier Detection has been mostly studied in the context of multiple application domains. Many algorithms have been proposed for outlier detection in high-dimensional data, uncertain data, stream data, and time-series data.
By its inherent nature, network data provides very different challenges that need to be addressed in a special way. Network data humongous in volume, contains nodes of different types, rich nodes with associated attribute data, noisy attribute data, noisy link data, and is dynamically evolving in multiple ways.
The concept of Outlier Detection from a networks perspective opens up a whole new dimension of outlier detection research. The detected outliers, which cannot be found by traditional outlier detection techniques, provide new insights into the application area.
The algorithms can be applied to several areas, including social network analysis, cyber-security, distributed systems, health care, and bio-informatics. Since both the amount of data as well as the linkage increase in a variety of domains, such network-based techniques will find more applications and more opportunities for research for various settings.
Outlier Detection and Data Mining
Finding outliers is an important task in data mining. Outlier detection as a branch of data mining has many important applications and deserves more attention from the data mining community.
Data mining involves algorithms of data mining, machine learning, statistics, and natural language processing, attempts to extract high quality, useful information from unstructured formats. The recent years have seen a tremendous increase in the adoption of text mining for business applications.
The reason being by increasing awareness about text mining and the reduced-price points at which text mining tools are available today.
Data analytics helps businesses listen to the right stories by extracting insights from a free text written by or about customers, combining it with existing feedback data, and identifying patterns and trends. Manual analysis alone is unable to capture this level of insight due to the sheer volume and complexity of the available data.

Wrapping Up
You may also go for a combined course in Text Mining and Data Analytics, to learn about the major techniques for mining and analyzing text data to discover interesting patterns, extract useful knowledge, and support decision making, with an emphasis on statistical approaches.
You will also need to learn detailed analysis of text data. Prior knowledge of statistical approaches helps in robust analysis of text data for pattern finding and knowledge discovery.
You will love to experiment with explorative data analysis for Hierarchical Clustering, Corpus Viewer, Image Viewer, and Geo Map. You can also learn to interactively explore the dendrogram, read the documents from selected clusters, observe the corresponding images, and locate them on a map.

Enroll in our Data Analytics courses for a better understanding of text data mining and their relation to Data Analytics. The industry-relevant curriculum, pragmatic market-ready approach, hands-on Capstone Project are some of the best reasons to gain insights on.