Introduction
Let me start this with a question, have you ever tried to learn something new but never made it to the end as there are no right resources to start with? or are you having difficulties gathering all resources that are scattered over the internet before starting something new to learn?
If your answer to both the questions is yes, then my friend, you are in for a treat. I know the hustle and that’s why I decided to write this comprehensive one-step solution for you to learn Python for Data Science. I will walk you through everything you need to know. From installing python and running your ‘hello world’ program to using libraries to make you Data Science ready or at least give you a head start.
Why Python
If you are a complete beginner than probably the first thing that will kick in your mind is why python? is that right? Let me tell you why,
First, open source. Always a plus point.
Second, unlike other languages you don’t need an Integrated development environment, python provides inbuilt idle for you to run python programs. However, you can use IDE if you want to. PyCharm- which is open source- and Enthought Canopy- which comes with both versions, community as well as enterprise- are two of my recommendations.
Third, and this is the best part, even though being a general-purpose programming language, there’s a whole dedicated community contributing to make it more than that. We will cover this in detail later in this post.
Fourth, you can use it both the ways, as a general purpose and for data science with help of great libraries available for python.
And last but not the least, it is easy to learn. Who doesn’t want that?
Installing Python – Hello World.
Let’s dive into python by first installing it. Installing python is as easy as spreading nutella on your bread. Depending upon which operating system you use, you can choose your mode of installation from the given two below.
For Ubuntu
sudo add-apt-repository ppa:jonathonf/python-3.6

sudo apt-get update

sudo apt-get install python-3.6
For Windows
You just go to the project site and download the executable file, run, install and you have python up and running on your machine. Open IDLE, create new file and type the following,
prinf("Hello World!")
There you have it, your first program using python. Make sure you don’t write semi-colon at the end of statement because in python we don’t use that.
Note: I recommend using any of the above-mentioned IDE to those who are complete beginners.
Basic Data Structures in Python
Data Structure are building blocks of any programming language, just as grammar is for high-level language. That’s why, before learning python for data science let’s understand the basic data structures in Python first. I urge you to follow comments in the snippets and you will understand the example easily. Even though, after considering comments, if you don’t understand something, let us know in the comments. We would love to solve your queries.
List
List in python is same as ‘array’ in other languages. Lists are mutable data types. Which means you can edit the content of list by applying methods.
listA = [1,2,3,4,5]                 #Create list using square braces []

listA.extend([6,7])                 #Extend the list
print(list)

listA.append([8,9])                 #Append elements to the list
print(list)

listB = [10,11,12]                  #Create another list

listoflist = [listA, listB]         #Join two lists
print(listoflist)                   #Print
Below is the list of different methods to manipulate ‘lists’ in order to achieve your goal.
| append() | Add single element to the list |
| extend() | Add elements of a list to another list |
| insert() | Insert element to list |
| remove() | Remove element from list |
| index() | Returns smallest index |
| count() | Gives occurrences of an element in the list |
| pop() | Remove element at given index |
| reverse() | Reverse a list |
| sort() | Sort elements |
| clear() | Remove all elements from the list |
Tuples
# indexing is from 0
# Same as list apart from tuples are immutable
# Use () instead of []

tuple = (2, 4, 6, 7)

#print length of tuple
print(len(tuple))

#print element at index 2
print(tuple[2])

#just like lists you can merge tuples too
a = (1, 2, 3)
b = (4, 5, 6)
merge = (a, b)
print(merge)
Functions
#Simple Function
def squareOfNumber(x):
     return x*x
print(squareOfNumber(3))

#Function using another function
def do(f,x):
     return f(x)
print (do(squareOfNumber,4))

#Inline Function
print (do(lambda x: x*x*x,5))
Looping
#loop
for x in range(15):        #Range in python defines scope of loop another example is range(3,8)
     print(x)

#loop with skip and continue functions
for x in range(10):
if(x is 1):                #in python keyword 'is' is same as '=='
     continue              # It will skip 1 and will continue the loop
if(x > 5):
     break                 # It will break loop
print(x)                   # Output of the following is 2,3,4,5

#while loop
x=0
while(x<10):
     print(x),
x += 1
Dictionary
Dictionary needs a little introduction. Dictionaries in python is nothing but a table that stores information with help of a unique key. Whenever you need that data, call it by the key it was assigned. Here key is ‘ship1’, ‘ship2’ and the values are name of captains.
#create the dictionary
captains = {}

#add values into it
captains["ship1"] = "Kirk"
captains["ship2"] = "Marcus"
captains["ship3"] = "Phillips"
captains["ship4"] = "Mike"

#fetch the data
#two ways to fetch the result from dictionary
print (captains["ship3"])
print (captains.get("ship4"))
File Read-Write
File read and write is not that mandatory but it is good to know that might be useful sometimes.
handle = open('kids','w')            #Open file name 'kids' with 'w'-write permissions

for i in range(2):                   #For 2 lines enter name
     name = input("Enter Name: ")
     handle.write(name + '\n')
     handle.close()

handle = open('kids','r')            #Open the same file in read mode

for line in handle:
     print(line)                     #print the names that was previously written
     handle.close()
Theodore Roosevelt, the 26th President of the United States, once said,
Believe you can and you’re halfway there
You learned installation of python plus all the basic data structure as well. Give yourself a little appreciation. Shake your head a little and hold tight because you are now going to learn Data Science using Python. If you found, what we have seen until now, a little difficult and fast, I highly recommend you taking Python Data Science Course from Digital Vidya which will cover all the basics of python as well as python libraries for data science which we are going to grasp now.
Python Libraries for Data Science
We will explore these libraries by categories. First we will see Data Wrangling, then second we will take a look at Data Visualization Libraries. After that we will advance to Python libraries for Machine Learning and Deep Learning. And finally we will take a look at miscellaneous libraries such as Natural Language Processing, Statistics and Data Scraping.
Now before using those libraries once should know how to install those libraries. That’s where pip comes handy. pip is a package/library manager. you will find everything you need to install pip on official documentation page here. Once pip is installed, you just have to run one liner as shown below and you will have your libraries install. Now let’s understand how they work. Shall we?
pip install library-name         #General syntax
pip install numpy                #installing numpy using pip
Data Wrangling
NumPy
When dealing with scientific tasks, one have to come to Python’s SciPy stack inevitably. Do not confuse it with SciPy library, SciPy Stack is collection of software specially designed for scientific and numerical computing in python and SciPy library is a part of that stack.
However, the most fundamental package is NumPy. It provides profuse of useful features for operation on arrays and matrices in Python. Very basic operation in math is to find mean, median, and mode. Let’s look at example.
import numpy as np                                  #Import library
from scipy.stats import mode                        #From library import specific module
n = int(input())                                    #Take input from user
arr = list(map(int, input()))                       #combine input and return list
print(np.mean(arr))
print(np.median(arr))
mod = mode(arr)
print(*mod[0])                                      #asterisk (*) removes square brackets
                                                    #while printing list
SciPy
SciPy is a library for science and engineering. It is built upon the basic functionality of NumPy. hence it it highly dependent on it. As you can see in the example above, it provides efficient numerical regime as numerical integration, optimization, and many others with help of specific sub modules. The functions in all sub modules of SciPy are well documented — another considerable advantage.
Pandas
Pandas is a Python package designed and aimed to do work with “relational” and “labeled” data. Pandas is by far the perfect tool for data wrangling. It is designed for quick and easy data manipulation, aggregation, and visualization(with help of other libraries).
There are two main data structures in the library: “Series” which is one-dimensional and “Data Frames” which is two-dimensional.
Things you can do with pandas includes, handle missing data, easily delete and add columns to and from data frames, and powerful grouping functionality. Let’s understand this with example.
#import library
import pandas as pd

#read data from comma separated value file using pandas
#df = data frame

df = pd.read_csv("Path to file")

#preview of data
print(df.head(6))

#shape/dimension of data
print(df.shape)

#column names
print(df.columns)

#Extract p articular column
print(df['Hired'])

#multiple columns
print(df[['Years Experience','Hired']])

#sorting the values
print(df.sort_values(['Years Experience']))

#value count for particular column variables
degree_count = df['Level of Education'].value_counts()
print(degree_count)
Data Visualization
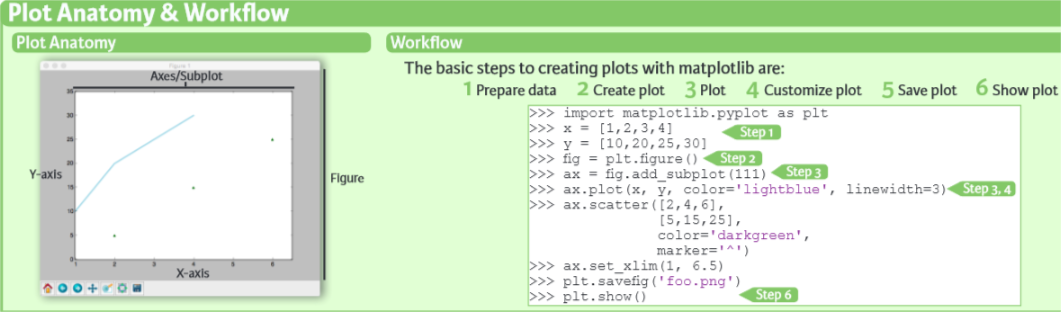
Matplotlib
Matplotlib is presumably the most used Python library for 2D plotting which produces publication-quality figures in a variety of formats. It is an eminent piece of software which is making Python (with little help of SciPy, NumPy and Pandas) an abreast competitor to tools such as Octave or MATLAB. From labels to legends everything is customizable in matplotlib.
However, to reach the advanced level of visualization you will generally have to put more efforts in writing more code. But once plotting is done, it is worth watching. With just a bit of effort, you can make the following,
Line Plots
Scatter Plots
Bar Chart/Histogram
Stem Plots
Quiver Plots
Seaborn
Seaborn is a library for making informative and appealing statistical graphs in Python; such as heat map. Seaborn is based on matplotlib and highly dependent on that but it should be taught as an accompaniment to matplotlib and not a replacement for it. It has some unique features such as built-in themes, tools for visualizing linear regression models, function to plot statistical time series data.
According to the official documentation, If matplotlib “tries to make easy things easy and hard things possible”, seaborn tries to make a well-defined set of hard things easy too.
Machine Learning
SciKit Learn
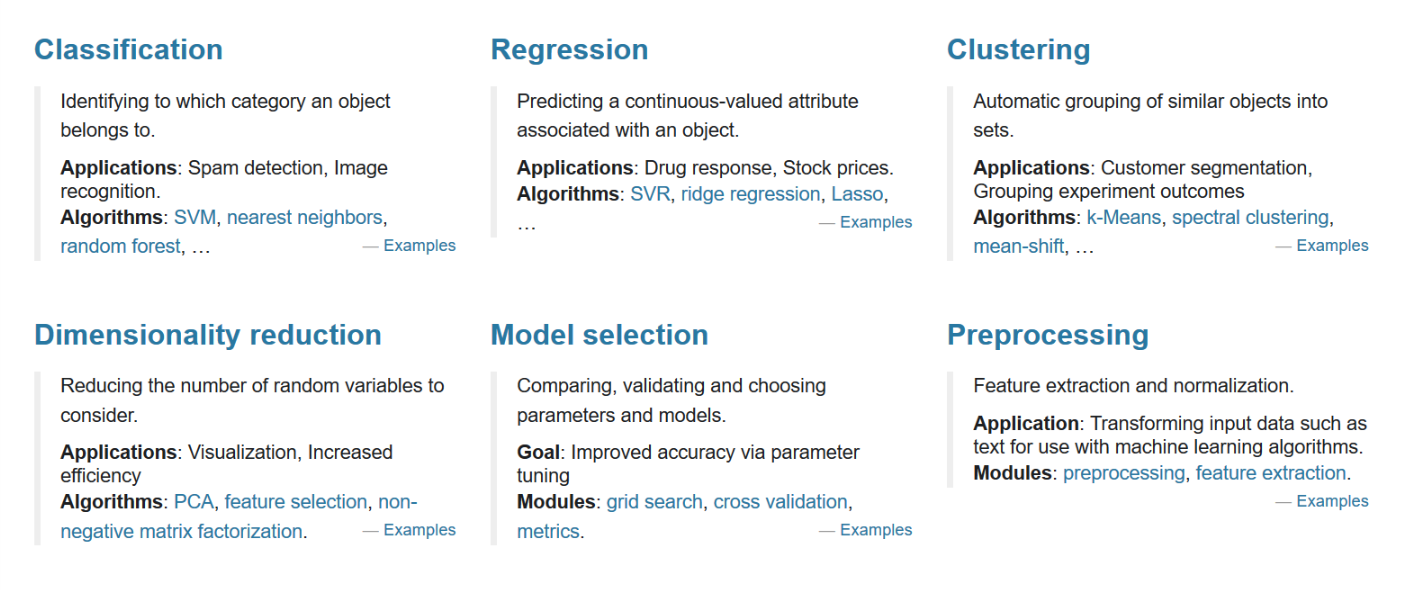
Python for Data Science and Machine Learning mainly uses libraries to perform the operations. It is specifically designed for functionalities like image processing and Machine Learning. In the regard of Machine Learning it is one of the most prominent package till date. It includes packages for classification, clustering, regression, pre-processing, and many more. Let’s write your first machine learning program to classify gender based on given height, weight and shoe size. We will use decision tree, support vector machine and KNN. To those who are completely new, these are the algorithms for solving real life problems.
Decision Tree
from sklearn import tree

# [Height, Weight, ShoeSize]
X = [[181,80,44], [177, 70, 43], [160, 60, 38], [154,54,37],
[166,65,40], [190, 90, 47], [175, 64, 39], [177,70,40],
[159,60,40], [171, 75, 42], [181, 85, 43]]

Y = ['male', 'female', 'female', 'female', 'male', 'male',
'male', 'female', 'male', 'female', 'male']

clf = tree.DecisionTreeClassifier()
clf = clf.fit(X,Y)

prediction = clf.predict([[190, 85, 40]])
print prediction
SVM(Support Vector Machine)
from sklearn.svm import SVC

# [Height, Weight, ShoeSize]
X = [[181,80,44], [177, 70, 43], [160, 60, 38], [154,54,37],
[166,65,40], [190, 90, 47], [175, 64, 39], [177,70,40],
[159,60,40], [171, 75, 42], [181, 85, 43]]

Y = ['male', 'female', 'female', 'female', 'male', 'male',
'female', 'female', 'male', 'female', 'male']

clf = SVC()
clf = clf.fit(X,Y)

prediction = clf.predict([[175, 65, 37]])
print prediction
KNN
#import dependicies
from sklearn.neighbors import KNeighborsClassifier

#[Height,Weight,Shoesize]
X = [[181, 80, 44], [177, 70, 43], [160, 60, 38], [154, 54, 37], [166, 65, 40], [190, 90, 47], [175, 64, 39],
[177, 70, 40], [159, 55, 37], [171, 75, 42], [181, 85, 43]]

Y = ['male', 'male', 'female', 'female', 'male', 'male', 'female', 'female', 'female', 'male', 'male']

#Fit trains the model
clf = KNeighborsClassifier()
clf = clf.fit(X, Y)

#prediction
predict = clf.predict([[170,87,37]])

#print output
print predict
Deep Learning
Tensor Flow
Firstly, let’s talk about Tensor flow. It comes from developers at Google. It is an open source library sharpened for Machine Learning. Initially it was developed to meet the high demand requirements at Google environment for training Neural Networks and is a successor of DistBelief, A ML system for training Neural Networks. Lately, Tensor flow is widely used in real world applications.
Key feature of Tensor Flow is multi layer node system which enables quick training of neural networks on large data sets. Tensor Flow Object Detection currently powers Google’s Voice Recognition and Object identification from picture.
Theano
Theano is a package that defines multi-dimensional arrays which is similar to NumPy, along with math operations and expressions. Originally developed by the Machine Learning group of Université de Montréal, it is primarily used for the needs of Machine Learning. Also, the library is compiled, making it run efficiently on all architectures.
The important thing to note is that Theano tightly integrates with NumPy on low-level of its operations. The library also optimizes the use of GPU and CPU, making the performance of data-intensive computation even faster.
Keras
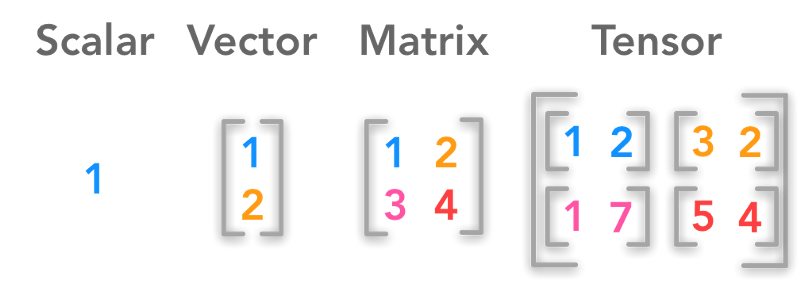
And finally, let’s look at the Keras. It is an open-source library for building Neural Networks at a high-level of the interface, and it is written in Python. The general idea of Keras is based on layers, and everything else is built around them. Data is prepared in tensors, the first layer is responsible for input of tensors, the last layer is responsible for output, and the model is built in between.
Conclusion
I tried to cover everything a beginner needs to learn for Data Science. From installation and basic data structure to high performing libraries for Machine learning and Deep Learning. These are the libraries that are considered to be the top of the list by many data scientists.
Of course, this is not the full list of libraries and there are many more worth exploring for specific tasks. I tried to cover more generalized in this post. To understand the process of extracting data, you should also know the process to conduct web scraping with Python.
If you wish to learn more in-depth about Python for Data Science, there are plentiful Python Tutorials but I recommend you to take Python Programming course by Digital Vidya. Also, if you have any other library that is useful and handy, let our users know in the comments.
Also, you will find Python Data Science cheatsheet related to all the libraries here.
Happy Learning.