John Tukey once said, “An approximate answer to the right problem is worth a good deal more than an exact answer to an approximate problem.”
That is exactly what regression analysis strives towards. It’s one of the most commonly used predictive modeling techniques that help make more informed decisions in important situations. In this article, we discuss what is regression analysis, how it works, and which is the best way to master it.
What is Regression Analysis?
Regression analysis is the first algorithm you need to master as a data scientist. It is one of the most commonly used predictive modeling techniques in data analytics. Even today, most companies use regression techniques to enable decision-making at scale.
To answer the question, “What is regression analysis”, we need to go down to the fundamentals. A simple regression analysis definition is that regression is a technique used to predict a dependent variable(Y) based on one or more independent variables(X).
A classic regression equation looks something like this:

In the above equation,
hθ(x) is the dependent variable Y
X is the independent variable
θ0 is a constant, and
θ1 is the regression coefficient
Applications of Regression Analysis
Regression analysis is used to make decisions in a number of business situations. There are three main applications of regression analysis.
(i) To explain something they are having trouble understanding. For instance, why customer service emails have fallen in the previous quarter.
(ii) To make predictions about important business trends. For instance, what will demand their product look like over the next year?
(iii) Choose between different alternatives. For instance, should we go for a PPC(Pay-per-click) or a content marketing campaign?
What are The Different Types of Regression Analysis Techniques?
It’s hard to find a very narrow regression analysis definition because there are a number of different regression analysis techniques. Most people tend to apply either of the two common ones, linear or logistic regression, to almost every regression problem.
However, there are a number of regression techniques available, and different techniques are more appropriate for different problems. Types of regression analysis techniques are based on:
(i) The number of independent variables (1, 2, or more).
(ii) The type of dependent variable (Categorical, continuous, etc).
(iii) The shape of the regression line.

Major Types of Regression Analysis:
1. Linear Regression
Linear regression is the most commonly used regression technique. Linear regression aims to find an equation for a continuous response variable known as Y which will be a function of one or more variables (X).
Linear regression can, therefore, predict the value of Y when only the X is known. It doesn’t depend on any other factors.
Y is known as the criterion variable while X is known as the predictor variable. The aim of linear regression is to find the best-fitting line, called the regression line, through the points. This is what the mathematical linear regression formula/equation looks like:
In the above equation,
hθ(x) is the criterion variable Y
X is the predictor variable
θ0 is a constant, and
θ1 is the regression coefficient
Linear regression can be further divided into multiple regression analysis and simple regression analysis. In simple linear regression, just one independent variable X is used to predict the value of the dependent variable Y.
In multiple regression analysis, on the other hand, more than one independent variable is used to predict Y. Of course, in both cases, there is just one variable Y. The only difference is in the number of independent variables.
For example, if we predict the rent of an apartment based on just the square footage, it is a simple linear regression.
On the other hand, if we predict rent based on a number of factors; square footage, the location of the property, and age of the building, then it becomes an example of multiple regression analysis.
2. Logistic Regression
To understand what is logistic regression, we must begin by understanding how it’s different from linear regression. In order to understand the difference between linear and logistic regression, we need to first understand the difference between a continuous and a categoric variable.
Continuous variables are numeric values. They have an infinite number of values between any two given values. Examples include the length of a video or the time a payment is received or the population of a city.
Categorical variables, on the other hand, have distinct groups or categories. They may or may not have a logical order. Examples include gender, payment method, age bracket and so on.
In linear regression, the dependent variable Y is always a continuous variable. If the variable Y is a categorical variable, then linear regression cannot be applied.
In case Y is a categorical variable that has only 2 classes, logistic regression can be used to overcome this problem. Such problems are also known as binary classification problems.
It’s also important to understand that standard logistic regression can only be used for binary classification problems. If Y has more than 2 classes, it becomes a multi-class classification and standard logistic regression cannot be applied.
One of the biggest advantages of logistic regression analysis is that it can compute a prediction probability score for an event. This makes it an invaluable predictive modeling technique for data analytics.
3. Polynomial Regression
If the power of the independent variable (X) is more than 1, then it’s known as polynomial regression. Here’s what a polynomial regression equation looks like
y= a +b*x^3
Unlike linear regression, where the best fit line is a straight line, in polynomial regression, it is a curve which fits into the different data points. Here’s what the graph for a polynomial regression equation looks like.
With polynomial equations, people are tempted to fit a higher degree polynomial as it results in a lower error rate. However, that might lead to over-fitting. It’s important to make sure the curve actually fits the nature of the problem.
It’s especially important to check the curve towards the ends and make sure the shapes and trends are falling into place. The higher the polynomial, the greater the chances that it produces strange results during interpretation.
4. Stepwise Regression
Stepwise regression is used when there are multiple independent variables. A special feature of stepwise regression is that the independent variables are chosen automatically, without human subjectivity getting involved.
Statistical values like R-square and t-stats are used to identify the right independent variables. Stepwise regression is often used when data sets have high dimensionality. This is because its goal is to maximize the prediction ability of the model with the minimum number of variables.
Stepwise regression adds or drops co-variates one at a time based on pre-defined conditions. It keeps doing this until the regression model is fitted.
5. Ridge Regression
When the independent variables are highly correlated(multicollinearity), ridge regression is used. When independent variables are highly correlated, the variances of the least-squares estimates are very large.
As a result, the observed value deviates a lot from the actual value. Ridge regression resolves this issue by adding a degree of bias to the regression estimates. Here’s what the ridge regression equation looks like:

In the equation above, the shrinkage parameter λ (lambda) is used to solve the problem of multicollinearity.
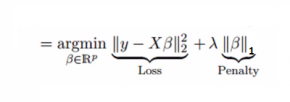
6. Lasso Regression
Just like Ridge Regression, Lasso Regression also uses a shrinkage parameter to solve the issue of multicollinearity. It also helps linear regression models by improving their accuracy.
It differs from Ridge Regression in that the penalty function uses absolute values instead of squares. Here’s the Lasso Regression equation:
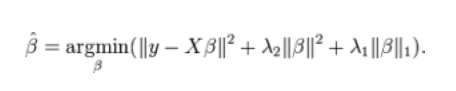
7. ElasticNet Regression
The ElasticNet Regression method linearly combines the L1 and L2 penalties of the Ridge and Lasso methods. Here’s what the ElasticNet Regression equation looks like:
Here’s a video that discusses the different types of regression analysis techniques in detail.
What are The Best Resources To Learn Regression Analysis
Regression analysis lies at the heart of data science and machine learning. While it’s relatively easy to understand the regression analysis definition and even learn the basics, optimizing a regression algorithm for better accuracy is quite difficult.
The resource that suits you best will depend on your goal behind learning regression analysis; whether it’s a casual interest, an academic pursuit, or whether you want a career in data science.
If it’s the latter, then a live instructor-led data science program might be your best bet. It will combine the advantages of a cutting-edge curriculum with two-way interaction, live sessions, assignments, and placement assistance.
Conclusion
Regression analysis is the foundation of machine learning and data science. It’s important to be aware of the different types of regression analysis techniques and when they can be applied. Luckily, there are many great courses that can help you get there.
Are you also inspired by the opportunities provided by Data Science? Enroll in our Data Science Master Course to elevate your career as a data scientist.