Understanding table calculations in Tableau is one of the basics you need to master if you’re interested in a career in analytics.
According to a KPMG survey, 81% of enterprises are relying on analytics to improve their understanding of customers.
Moreover, 92% of C-level executives are using analytics to get better marketing insights.
Most companies have realized that strong analytics can help them make better decisions in almost every area of business from supply chain to marketing. At the same time, good analytics is only possible when companies employ people who really know what they’re doing.
No wonder then that analytics is now one of the most sought-after careers for people who want to become a Data Scientist. However, to generate meaningful insights using analytics, one needs to really have a grip on important analytics tools like Tableau.
What is Tableau?
Tableau is an end-to-end data analytics platform. It is one of the most popular business intelligence tools that makes data visualization and analysis really powerful. It processes large amounts of data and displays it in a way that’s visually appealing. The insights from raw data that Tableau can bring forth are unparalleled.
It allows companies to get more insights in a particular business area, whether it’s marketing, operations, or supply chain. This allows for more informed decision making. Here are some basic features of Tableau.
(I) Connecting to Different Data Sources
Tableau can easily pick up data from sources like Excel, CSV, Tera Data, Google Analytics. This allows you to process data from diverse sources.
(II) Tableau Desktop or Tableau Server Based on Need
You can use Tableau Desktop if you are an individual user. The focus of this software is more on basic data visualization by drawing data from different sources. Tableau 10.5.1 is the Current latest version of Tableau Desktop.
Tableau Server, on the other hand, is for enterprises. The focus of this tool is on collaboration and keeping the data visualizations secure and confidential. Tableau Server can be used to share data within the company.
Benefits of Tableau
In the recent past, Tableau has emerged as one of the most popular business intelligence tools. This is because it has certain advantages that make it a cut above the rest. Here are some of them.
(I) Easy Learning Curve
As it does not require a lot of programming expertise, anyone can learn it and operate it to process large amounts of data. It doesn’t have a complex software setup process either. An analytical bent of mind is what is more important than coding ability.
(II) Can be Used on Many Kinds of Devices
Tableau can be used in all kinds of desktop and mobile devices. Therefore, users don’t have to worry about having specific hardware or software.
(III) Visualization
The strength of Tableau lies in the fact that it makes data visualization possible. Using colors, trend lines, graphs and charts can help understand trends better and generate actionable insights.
(IV) Centralization & Collaboration
Tableau Server gives you a centralized location where you can manage all the data sources of your company. Moreover, it also allows you to filter, sort and discuss data when you’re on the move. Colleagues can see the updates you make by just refreshing their browser.
Why use Table Level Calculations in Tableau
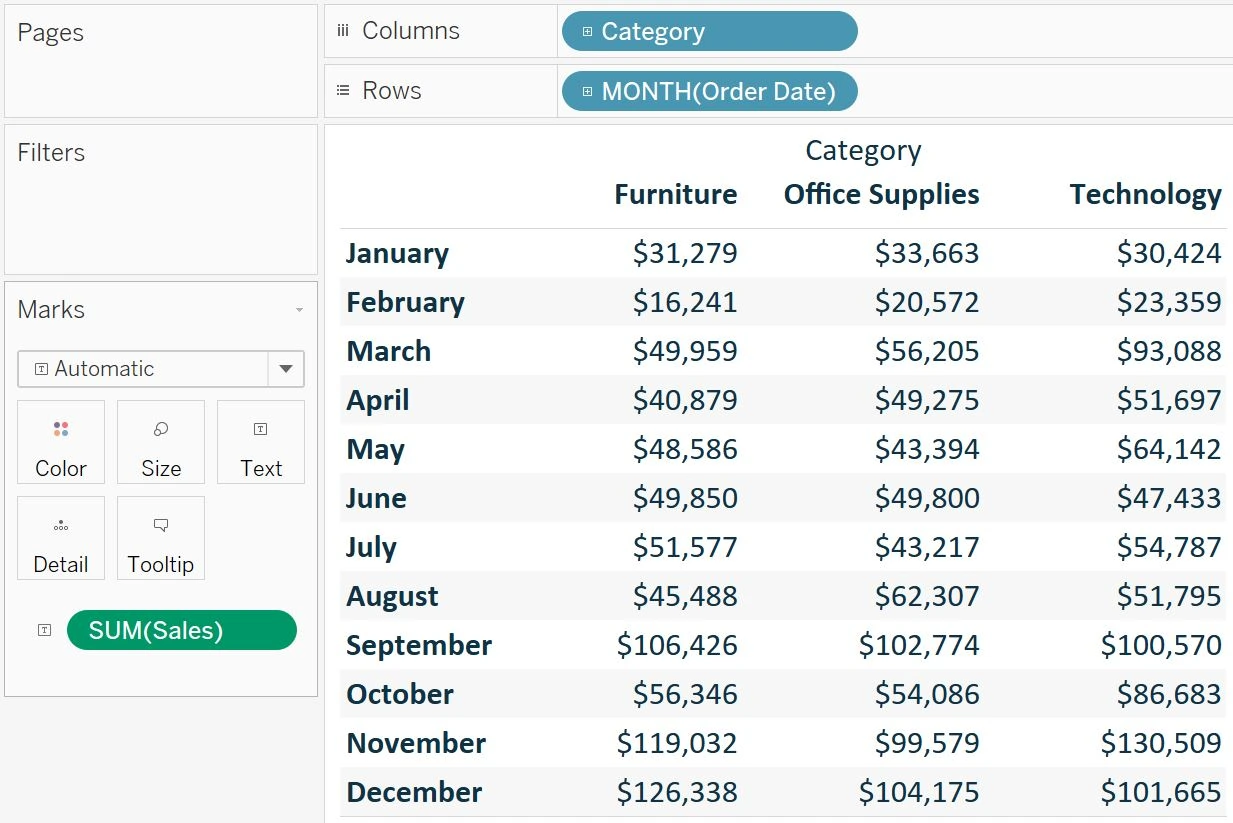
Quick table calculations in Tableau allow you to compute results based on a virtual table that only includes the numbers in a particular view. You can do a number of quick calculations in Tableau including running total, difference, per cent difference, per cent of the total, moving average, and others. Table calculations in Tableau provide the following benefits.
- Table level calculations in Tableau can be saved for use in the future as calculated fields. Since calculated fields can be edited later, table calculations are a great way to learn syntax and functions in Tableau.
- Quick table calculations in Tableau are possible because the table calculation functions use only a small subset of the data and not the entire data. This makes it possible to do a number of table calculations in limited time.
- Table level calculations in Tableau allow you to do advanced calculations without having to know the underlying syntax. This makes it efficient and significantly reduces the learning curve.
Some Quick Table Calculation Functions in Tableau
Here are some of the important table calculation functions in Tableau. This list is by no means exhaustive. At the same time, it gives an insight into how table calculations in Tableau work and what their scope is. Tableau tutorial is also a great way to master basic calculations.
Here’s a video that discusses fundamental table calculation functions in Tableau.
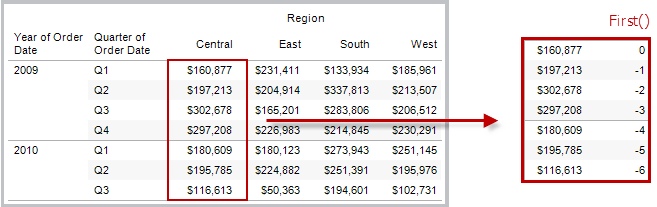
(I) FIRST( )
This table calculation function in Tableau returns the number of rows from the current row to the first row in the partition. For example, the view below shows quarterly sales. When FIRST() is computed within the Date partition, the offset of the first row from the second row is -1.
Example
When the current row index is 3, FIRST() = -2. This gives an idea of the number of rows that are there from the current row to the first row.
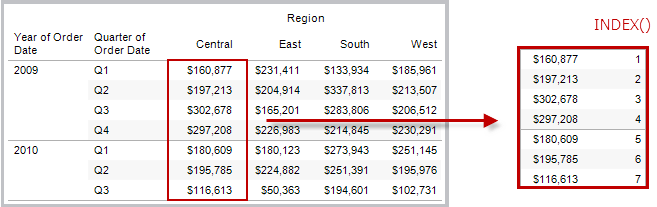
(II) INDEX( )
This table calculation in Tableau returns the index of the current row in the partition. However, there is no sorting with respect to the value. The first-row index starts at 1 and others follow suit. For example, the table below shows quarterly sales. When INDEX() is computed within the Date partition, the index of each row is 1, 2, 3, 4…, etc.
Example
For the third row in the partition, INDEX() = 3. This helps you identify which row particular data is in.
(III) LAST( )
This table calculation in Tableau returns the number of rows from the current row to the last row in the partition. It is a kind of converse function of the FIRST() function. For example, the table below shows quarterly sales. When LAST() is computed within the Date partition, the offset of the last row from the second row is 5.
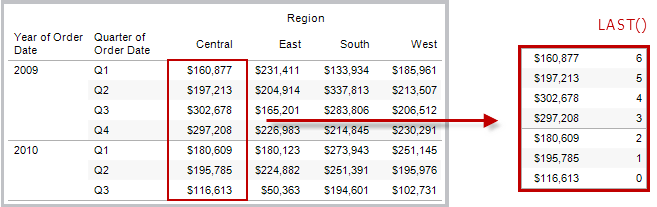
Example
When the current row index is 3 of 7, LAST() = 4.
(IV) RANK(expression, [‘asc’ | ‘desc’])
This table calculation in Tableau returns the standard competition rank for the current row in the partition. In this function, like in most statistical models that determine rank, the same values are assigned an identical rank. Users need to use the optional ‘asc’ | ‘desc’ argument to specify if they want an ascending or a descending rank. The default way of sorting is set as descending.
For example, using this function, the set of values (5, 10, 10, 2) would be ranked (2, 1, 1, 3).
Null values are ignored for the purpose of calculations in this function.
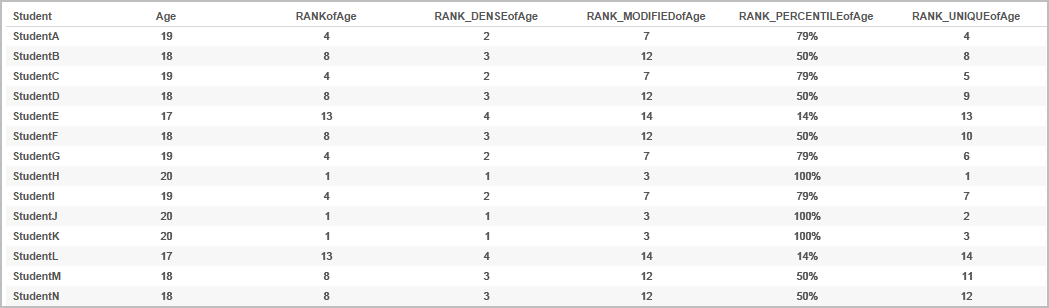
Example
The following table shows the effect of the RANK function for a set of values. There is the age of about 14 students (StudentA through StudentN) in this table. The third column shows the ranks of the students after the RANK function has been applied. As you can see students of the same age, for instance, StudentA and StudentC have the same rank, that is 4.
(V) RANK_DENSE(expression, [‘asc’ | ‘desc’])
This table calculation in Tableau returns the dense rank for the current row in the partition. There are no gaps in the numbers sequence in this function, which is how it differs from an ordinary rank function. Users need to use the optional ‘asc’ | ‘desc’ argument to specify if they want an ascending or a descending rank. The default way of sorting is set as descending.
With this function, the set of values (6, 9, 9, 14) would be ranked (3, 2, 2, 1).
Null values are ignored for the purpose of calculations in this function.
(VI) RANK_MODIFIED(expression, [‘asc’ | ‘desc’])
This table calculation in Tableau returns the modified competition rank for the current row in the partition. This is in contrast with the standard competition rank that the regular RANK function returns. Like the RANK function, identical values are assigned an identical rank. Users need to use the optional ‘asc’ | ‘desc’ argument to specify if they want an ascending or a descending rank. The default way of sorting is set as descending.
With this function, the set of values (6, 9, 9, 14) would be ranked (4, 3, 3, 1).
Null values are ignored for the purpose of calculations in this function.
(VII) RANK_PERCENTILE(expression, [‘asc’ | ‘desc’])
This table calculation in Tableau returns the percentile rank for the current row in the partition instead of the standard rank. Users need to use the optional ‘asc’ | ‘desc’ argument to specify if they want an ascending or a descending rank. The default way of sorting is set as descending.
With this function, the set of values (6, 9, 9, 14) would be ranked (0.25, 0.75, 0.75, 1.00).
Null values are ignored for the purpose of calculations in this function.
(VIII) RANK_UNIQUE(expression, [‘asc’ | ‘desc’])
This table calculation in Tableau returns the unique rank for the current row in the partition. This differs from the regular RANK function because identical values are assigned different ranks based on when they appear in the partition. Users need to use the optional ‘asc’ | ‘desc’ argument to specify if they want an ascending or a descending rank. The default way of sorting is set as descending.
With this function, the set of values (6, 9, 9, 14) would be ranked (4, 2, 3, 1).
Null values are ignored for the purpose of calculations in this function.
Conclusion
Tableau is indeed one of the most useful business intelligence and analytics tools out there. This article gives you a taste of how Tableau can be used to do basic and advanced table calculations to get nuanced insights from large amounts of data.
If you are looking forward to building a career in Tableau, you should be aware of tableau certification & should be aware of all the latest trends happening in the Tableau domain along with knowing how to create a perfect Tableau Resume
While understanding Tableau, you should also be aware of Data Blending. Over the years, Data Blending in Tableau has gained immense popularity amongst the Data Analysts & has the potential of blending and joining data sources.
Those who are serious about a career in analytics should definitely consider Tableau Certification Course.