Both Tableau and Power BI are fast gaining importance as tools for gathering data insights. While drawing an analogy between the two, Tableau vs Power BI, we find that each has its own set of merits and demerits.
Power BI vs Tableau: The Need For Business Intelligence Tools
Hugo Moreno stated in a recent Forbes article, “Data analytics skills gaps persist across the enterprise, as 27% of analytics professionals surveyed cite this skills gap as a major impediment in their data initiatives.”
Enterprises across the world are facing increasing complexity and market volatility, and are turning to data-driven analytics and insights to manage this increasing uncertainty, and for better understanding their organizations’ customer bases and growing their businesses.
The move to data-driven insights is being forced by continued business reliance on technology and automation throughout the enterprise, driving the enterprise’s appetite for better data, more advanced analytics skills and the implementation of best practices.
Both Tableau and Power BI include intuitive data evaluation tools and make business managers work simpler. Although alternatives exist and offer a similar set of features, which one of these is the best choice for getting started, depends largely on the purpose of use.
The Internet is flooded with Tableau and Power BI ppts and biased viewpoints. It is therefore important to understand Tableau and Power BI fully, before heading for a Tableau vs Power BI.
Tableau, since its inception, has come a long way and is known as the market leader for BI tools and data analytics. Microsoft Power BI, on the other hand, is a relatively younger player that has grown to be the closest competitor for Tableau.
Our discussion on Tableau and Power BI will include the strengths and weaknesses of both the tools and how suits its specific businesses based on requirements. In this discussion, we will do a comparison study between the two business tools which will help companies to decide the best for their needs.

Video on Microsoft Power BI vs Tableau:
Power BI vs Tableau: Definition
Tableau has in customers in more than 70,000+ organizations worldwide and has 500 global user groups.
Tableau is a complete, easy-to-use analytics solution and we have added even more capabilities for people to analyze data in new ways, including native support for spatial data, support for data stored in PDF files, native integration with Python, and the ability to view details in a few clicks with viz in tooltips.
And we are helping people stay on top of their data with support for data-driven alerting, rich discussions, and user-defined subscriptions.
Power BI has grown from a mere SharePoint feature to a service that came out of preview in July 2015, and it was already being used by 500,000 users at 45,000 companies in 185 countries.
Power BI vs Tableau: The Growing Importance
Both Tableau and Power BI are fast gaining importance as tools for gathering data insights. Microsoft Power BI is a cloud-based analytics and business intelligence platform that offers a full overview of critical data.
It simplifies data sharing and evaluation for users by connecting to all data sources and offers scalable dashboards that make it easier for users to choose various visualizations as blueprints, then drag and drop the data from navigation into the visualization.
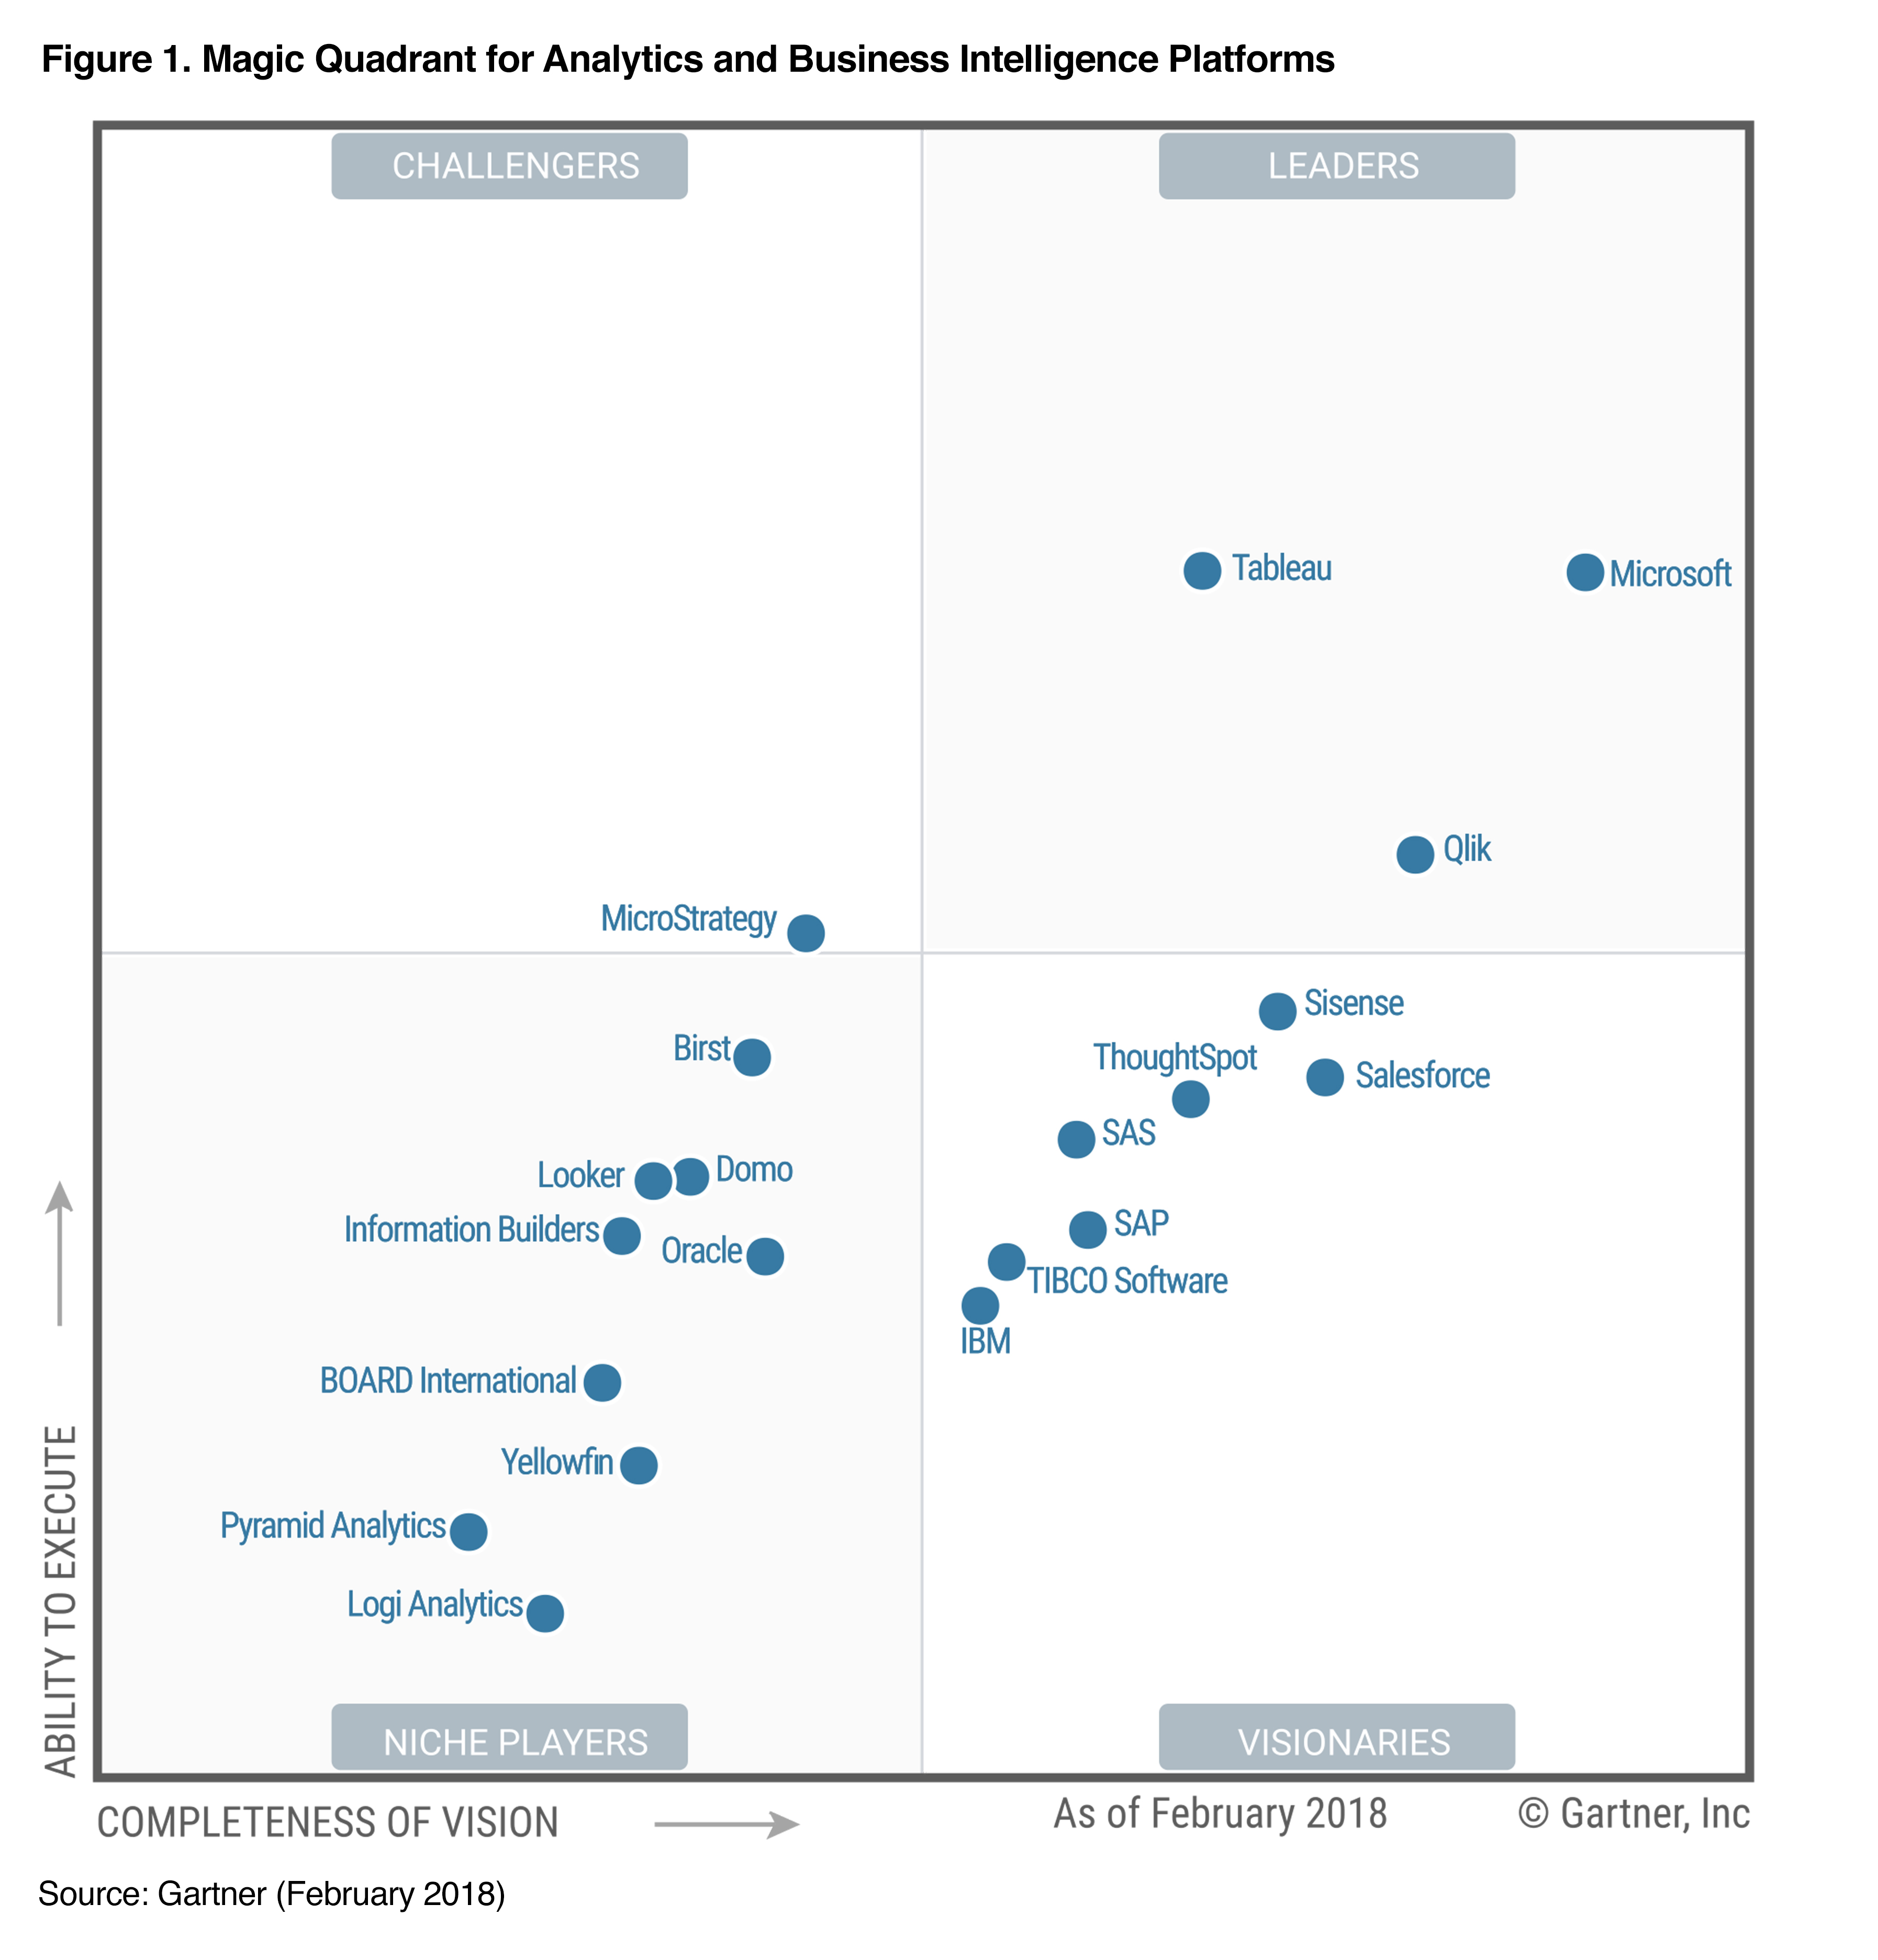
For 11 consecutive years, Microsoft BI is s positioned in the Leaders quadrant in the Gartner Magic Quadrant for Analytics and Business Intelligence Platforms 2018 edition. Please refer to the diagram below to understand Microsoft Power BI vs Tableau better, in terms of usage and market share.
While drawing an analogy between the two, Tableau vs Power BI, we find that each has its own set of merits and demerits.
In this discussion, I have tried to highlight the key pros and cons of both and include comprehensive business intelligence tools leaderboard showing how each stack up across key business and functional requirements.
Tableau vs Power BI: Data Visualization
Tableau’s user-friendly interface allows non-technical users to quickly and easily create customized dashboards to provide insight into a broad spectrum of business information.
The drag-and-drop capabilities, coupled with its extensive data source connections, make Tableau a front-runner in the realm of data visualization.

Microsoft Power BI, one the other, is one of the most user-friendly data visualization tools in the business intelligence market. The drag-and-drop functionality of the software, along with access to over 85 data visualization applications, ensures an amazing user experience that translates in visually appealing and informative reports.
In addition, Microsoft Power BI utilizes many of the same functions available in Excel. Thus, Office users will find it easier to adapt to this visualization tool. Creating reports through Microsoft Power BI is great for data portraits that can be shared across teams and accessed on any device.
Tableau vs Power BI: Data Sources
One of the best things about Tableau is that it offers support for hundreds of data connectors including online analytical processing (OLAP) and big data options (such as NoSQL, Hadoop) as well as cloud options.
Thus, when users want to add data from multiple sources Tableau determines the relationship automatically. In addition, Tableau empowers users to modify data links or create them manually based on their company’s preferences.

Power BI is capable of connecting to users’ external sources including SAP HANA, JSON, MySQL, and more. Like Tableau, Power BI is able to determine relationships when users add data from multiple sources.
In addition, it enables users to connect to Microsoft Azure databases, third-party databases, files and online services like Salesforce and Google Analytics.
Tableau vs Power BI: Analytics
Tableau is aimed at providing a tool to enterprises that reflects their urgent analytics requirements. This shows through the enhancements to data federation, streamlined interfaces, advanced analytics and improvements to mobile exploration and authoring.
Tableau, in fact, reflects the organizational needs of moving beyond the data visualization aspects of their applications and getting more advanced analytics work done. It also supports more complex data federation workflows, making data mashups more reusable and making improvements to mobile app development to support all mobile screen sizes is available in the software.
Microsoft BI ensures an easy-to-learn, low-cost Power BI experience. The analytics interface of Power BI closely resembles Excel, assuring recognizable functionality. It creates complex data analyses that include premise-based data sources and integration points.
Data prep, data discovery and interactive dashboards are all included in the Power BI Suite and Power BI Desktop. Measurement, organizational and predictive features allow for simple data management and trend interpretation. Besides the tools for standard data analysis, Power BI hosts integration with location-based data programs such as SQL Server Geospatial, BING, and Esri ArcGIS.
Tableau vs Power BI: Document Management
Tableau enables users to publish analytics content on a variety of publishing platforms. Options available for report formatting include PDFs, spreadsheets, images, and crosstabs. Users can view all stages of a report’s creation with a feature that archives all past versions to be viewed later.

On the other hand, the reports generated in Microsoft Power BI can be exported as PDF, TIFF, HTML and Microsoft Office files. Power BI files include desktop files (.pbix) and templates (.pbit).
With Microsoft as the engine behind Power BI, report exporting and document access is simple. However, Power BI does not directly support version control.
Tableau vs Power BI: Integrations
Tableau offers improved support for REST APIs and JavaScript, making integration across analytics platforms more efficient and less reliant on customized programming.
Tableau’s integration support is mainly through the use of APIs, making way for streamlined collaboration with programs such as Google Analytics, SAP, Salesforce, Microsoft Office, enterprise resource planning software and social media channels.
Security system integrations with programs such as Active Directory, Kerberos and OAuth add an extra level of protection to the software’s built-in security measures.
Power BI vs Tableau: Which One is Better
Microsoft Power BI is ahead, because of Microsoft’s familiarity and connections to assorted applications. Users of Microsoft Power BI can mine data from programs such as Microsoft Excel, Google Analytics, MySQL, Oracle, Salesforce, MailChimp, Facebook, and Zendesk, with new data sources added every month.
The Microsoft foundation of this analytic tool ensures a smooth meshing of Power BI with the existing work base of a business. One of the more innovative features of Microsoft Power BI is the ability to use browser- and desktop-based authoring with apps and platforms that are both on-premise and in the cloud.
This hybrid integration strategy is based on the Microsoft Azure Cloud APIs.
The Microsoft backing of the Power BI platform ensures faster and simpler integration with a number of external applications. Almost every program that works with Microsoft can integrate with Power BI, offering an expansive library of possible collaboration options.
Power BI can already pull data from a wide range of cloud services, including MailChimp, Zendesk, Salesforce, QuickBooks, Twilio, GitHub, UserVoice, and even Google Analytics.
Microsoft Power BI vs Tableau: Choosing Between the Two
Both Tableau and Power BI are great BI tools. Both have varying strengths and weaknesses that are common when comparing BI tools.
While Tableau allows users to integrate an infinite amount of data points in their analysis and offers comprehensive support options, Power BI is better for smaller companies who are looking for a more affordable business intelligence solution.
However, choosing one over the other depends on the user’s business size and analysis needs. If data visualization is your core focus, Tableau is the best answer.
Microsoft’s Power BI is a solid option if you need quick access to specific analytics or intensive reporting. It has extensive R and big data-related integrations, ensuring this apps’ scalability for larger projects.
Microsoft Power BI vs Tableau: Takeaway Facts
For more insights, you may look up for on the Internet for Tableau vs Power BI ppts, where you can read about users’ experience with Tableau and Power BI, and business intelligence software in general. This Tableau vs Power BI ppts will also help gain insights about real-life scenarios, how and when are the tools used.

Now that you know a lot about the pros and cons of both from our discussion on Microsoft Power BI vs Tableau, you may enroll for an advanced degree course in Power BI or Data Analytics. It would give your data analytics career, the right boost.
At Digital Vidya we offer one of the best-known Data Analytics Certification Training with Excel and Power BI. The course enables you to learn tools such as Advanced Excel, Power BI, and SQL. The live projects and intensive training program also empower you to come up with solutions for real-life problems.