Humans have a tendency to understand things better when they see things visualized. Data Visualization is, primarily, representing data in a graphical format so that everyone including a layman can understand certain scrutiny. And no, it isn’t limited to a bar chart, pie chart or histograms. It goes far beyond that and qualifies decision-makers to find patterns. That’s the brief idea, so accordingly, what I believe is,
Data Visualization is Art as well as Science. Art because one must know how to represent the data and Science because one must collect and process, correct and pertinent data for visualization.
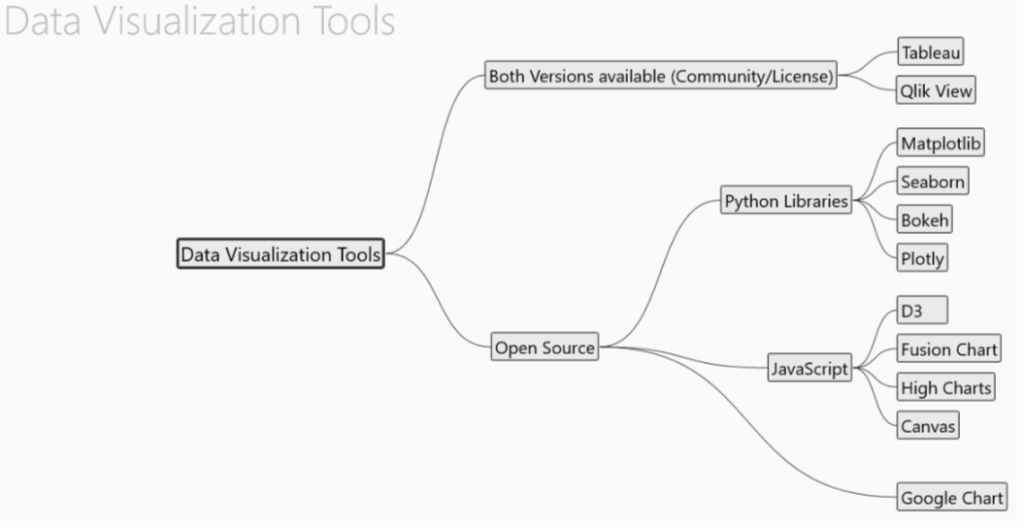
Now, let’s talk about how to visualize data using visualization tools. There are several open-source as well as enterprise tools available for Data Visualization in Big Data. Here, I’ll discuss Paid as well as Open source tools which I believe are capable of changing the data-driven world. Each with their unique aspect.
Tableau
(Enterprise as well as Community edition)
Tableau is a front-runner from all the data visualization tools that are available today, and it deserves the position. Because of its simplicity and ease of producing interactive visualization, which is far better than provided by other BI solutions, tableau has over 57,000+ accounts from different industries. It added 3,300 customers alone in Q2FY2017. Tableau is uniquely well suited to fast, growing and constantly changing data which are used in Big Data including AI (Artificial Intelligence) and Machine Learning. This is possible because of integration with a substantial number of advanced database solutions. Which includes Hadoop, Amazon AWS, SAP, and Teradata.
Qlik View
(Enterprise as well as Community edition)
Qlik View is another extensive player in Visualization industry and the biggest challenger to the tableau. The vendor has over 40,000+ customer accounts across over 100 countries. Qlik View is all about flexibility. It offers a high range of customization. However, this flexibility often comes with a level of complexity which may be immense for new users. And can be a bugbear, especially for those with no technical or analytical background. It is generally used alongside its brother package Qliksense, which can highlight patterns in data and handles data exploration as well as discovery.
Matplotlib
(Open Source)
Matplotlib is presumably the most used Python library for 2D plotting which produces publication-quality figures in a variety of formats. It is an eminent piece of software which is making Python (with little help of SciPy, NumPy and Pandas) an abreast competitor to tools such as Octave or MATLAB. From labels to legends everything is customizable in matplotlib.
However, to reach the advanced level of visualization you will generally have to put more efforts in writing more code. But once plotting is done, it is worth watching. With just a bit of effort, you can make the following,
- Line Plots
- Scatter Plots
- Bar Chart/Histogram
- Stem Plots
- Quiver Plots
- Heatmaps
- Spectrograms
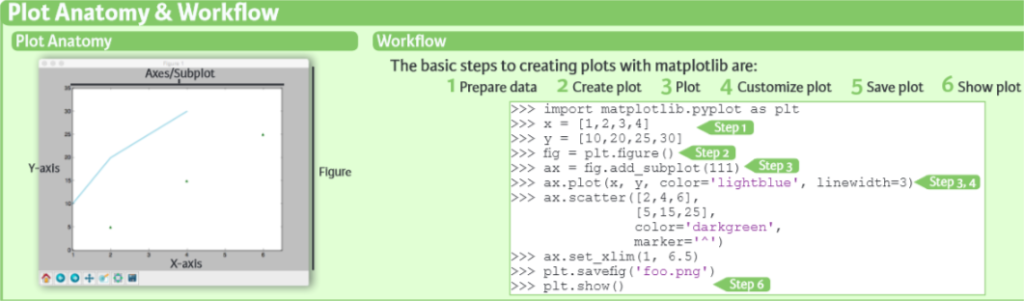
Plot anatomy and Workflow in matplotlib
Seaborn
(Open Source)
Seaborn is a library for making informative and appealing statistical graphs in Python; such as a heat map. Seaborn is based on matplotlib and highly dependent on that but it should be taught as an accompaniment to matplotlib and not a replacement for it. It has some unique features such as built-in themes, tools for visualizing linear regression models, function to plot statistical time series data.
According to the official documentation, If matplotlib “tries to make easy things easy and hard things possible”, seaborn tries to make a well-defined set of hard things easy too.
Bokeh
(Open Source)
Bokeh is again interactive visualization library in python that targets modern web browsers for presentations. Its focus is to provide graceful construction of graphics in style of Data-Driven Documents (d3.js), and extend the capabilities for abundant or streaming datasets. It provides multiple visualization interfaces, for example,
- Charts– A high-level interface for statistical plots
- Plotting- An intermediate level interface mostly concerned with composing visual pictogram
- Models- A low-level interface that provides utmost plasticity to application developers
Here’s a quick Github statistics for Visualization libraries in Python.
!function(e,t,s,i){var n=”InfogramEmbeds”,o=e.getElementsByTagName(“script”)[0],d=/^http:/.test(e.location)?”http:”:”https:”;if(/^\/{2}/.test(i)&&(i=d+i),window[n]&&window[n].initialized)window[n].process&&window[n].process();else if(!e.getElementById(s)){var r=e.createElement(“script”);r.async=1,r.id=s,r.src=i,o.parentNode.insertBefore(r,o)}}(document,0,”infogram-async”,”https://e.infogram.com/js/dist/embed-loader-min.js”);
d3.js
(Open source)
Data-Driven Document (d3.js) is a javascript library for visualization using web standards. It can help you bring data to life in form of SVG, Canvas and HTML. For example, you can use D3 to produce an HTML table from an array of numbers. Or, use the same data to create an interactive SVG bar chart with effortless transitions and interaction.
Fusion charts
(Free but license for commercial use)
Fusion charts is a Free charting tool that can be used to render the data-driven animated chart. Fusion chart can be used with any web scripting language like JavaScript, [dot]NET, Ruby on Rails, etc., to deliver interactive charts. Apart from the basic features, the prime trait that makes Fusion Charts my favorite is for the following reason. Rather than creating, storing and streaming charts (in the form of images) on the server-side, it does render all the charts on the client-side using widely installed Adobe Flash. The server is only responsible for streaming the pre-built SWF files and XML data files to the end viewers.
High Charts
(Free but license for commercial use)
Highcharts is a pure JavaScript based charting library meant to magnify web applications by adding interactive charting capability. It braces a wide range of charts. Charts are drawn with help of SVG in standard browsers including Internet Explorer (Yes, The great IE).
The Great thing about the High chart is it is extremely lightweight, the entire highchart.js core library is of size 35KB. Moreover, other features include compatibility with all browsers as well as mobile platforms like Android as well as iOS, Dynamic, supports loading data dynamically from the server.
Google charts
(Open source)
Google Charts is a fusion of two different APIs. One is Google Chart and the other is Google Visualization. Both used for creating static visualizations and embed them into web pages. A little bit of HTML programming experience is recommended before using Google Charts. Google charts provide several visualization chats. Which includes bar, standard scatter, pie also box charts and Venn diagrams.