If you are wondering what is big data analytics, you have come to the right place! Here, details of the concepts of big data analytics are explained in detail.
With the help of big data analytics, the company’s operational improvement can surge up to a great extent. This is because big data analytics examples offer numerous informational and business insights that accelerate the growth and development of a company.
The IT teams face a lot of challenges posed by the value which is hidden in the raw data. The needs and data assets vary from one company to another.
Since the market-place is ever-accelerated, the business initiatives can keep changing accordingly and you would need scalability and agility to keep up with the new directives.
In the past, the minimum access to automation and computing power made the operation of big data analytics operation beyond the company’s reach. Big data analytics was way too expensive, involved a lot of hassle and a clear ROI was also absent.
Close to 99% of the organizations believe that data is crucial for successful marketing.
In today’s age, new technologies and cloud computing techniques have risen to an impressive extent in compute resource management?
This has made big data analytics tools to be more accessible than ever before. This big data analytics tutorial will help you understand these concepts better.
What is Big Data Analytics?
Big data analytics is a pretty complex process of uncovering information by examining varied and large data sets. These data sets are sometimes referred to as big data.
The uncovered information may be in the form of unknown correlations, hidden patterns, customer preferences and market trends which can be useful for organizations while making informed decisions in business.
Broadly, the data analytics technology and technique offers a stable means for analyzing data sets and draw conclusions accordingly.
This helps a company make the right business decisions. BI or business intelligence queries answer all the basic questions with regard to business performance and operations.
Big data analytics tutorial is a type of advanced analytics solution which involves truly complex applications along with their elemental components like statistical algorithm, predictive models, and the high-performance analytics powered “what-if” analysis.
Types of Data Analytics Examples and Applications
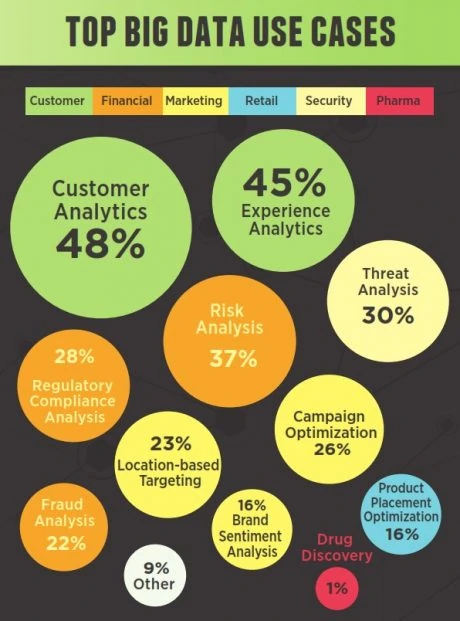
Wondering what is big data analytics application? There are several areas where knowing and learning what is big data analytics plays an important role in helping the business grow and get distinct from its competitors.
Here are a few such application areas.
1. Healthcare
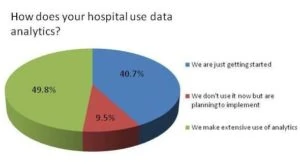
In the healthcare centers, data analysis is used to track and optimize the patient flow, their treatment and also the usage of equipment. This can drastically improve the functions and processes in the hospital.
2. Risk & Fraud Detection
Big data analytics tools were used by several organizations that were having issues with the debt. From the customer data collected which was collected when the customers applied for loans, they were able to apply data science analytics to overcome the previous losses incurred.
The recent expenditures, customer profiles, and other important data were analyzed and the probability of any customer defaulting was inferred from this.
3. Transportation
During the Olympics in London a few years back, about 18 million journeys needed to be handled, this was sorted out with the help of what is big data analytics and its techniques.
The train operators along with the TFL made use of the techniques of big data analytics tutorials in order to forecast the number of people attending the event and using that data to ensure that these journeys by athletes as well as fans from one stadium to the other were undertaken comfortably.
4. Delivery Logistics
Several logistics companies like FedEx, DTDC, DHL, etc make use of the data in order to improve the efficiency of their delivery logistics operations.
With the help of data analytics, several delivery logistics companies have found ways to devise the best shipping routes, suitable delivery time and the most ideal means of transport and in turn, have been successful in gaining cost efficiency.
5. Customer Interactions
One of the arenas which uses data analytics for customer interactions is insurance. Insurers can determine and rectify any issues with their services by carrying out customer surveys regularly after they have interacted with the claim handlers.
Using Big data analytics tutorials one can get clarity about which services of theirs are good and which ones are bad. By taking the customer demographics along with their feedback, insurers can improve the customer experience on the basis of the insights and behavior of the customer.
Data Analytics Process
It is very important to know the data analytics process while learning what is big data analytics. If you are wondering about what is big data analytics process, read on.
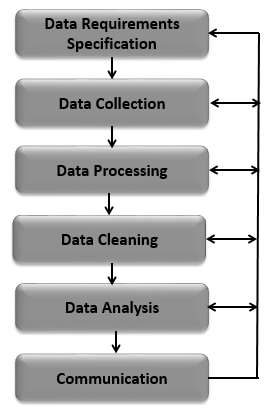
1. Data Requirements Specification
The data which needs to be analyzed is based on an experiment or a question. The specific variables with respect to the input data in the form of category or numerals need to be obtained or specified.
2. Data Collection
This is the process of consolidating the information received on target variables which are identified as the data requirements. The emphasis during this stage of the process is given to an honest and accurate collection of data.
3. Data Processing
The data which is collected in the previous step is then organized and processed for further analysis. For this, a data model may have to be constructed.
4. Data Cleaning
The organized and processed data received from the previous step may have duplicates or maybe incomplete with errors. Data cleaning is the stage where the errors in organized and processed data are corrected and their occurrence in the future is prevented. There are various Data cleaning techniques available. You can choose one as per your requirement.
5. Data Analysis
The clean data received which is free of any form of error is then ready for analysis. Various data analysis techniques like data visualization, data model generation, regression analysis, etc, can be used for data analysis.
6. Communication
The end result obtained after data analysis is then reported in a specific format that is used by the users to make decisions and take further required actions.
How do Big Data Analytics tools Make Working so Easy?
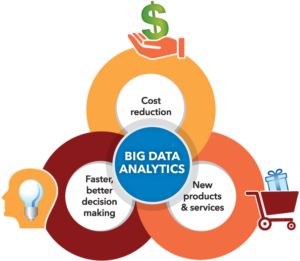
Before digging deep into what is big data analytics, you need to know why it is so important for the growth of a business. Big data analytics is driven by high-powered analytics software and specialized computing systems. Big data analytics examples make working easy by offering the following benefits.
(a) It provides opportunities for new revenues.
(b) It offers a way to carry out effective marketing.
(c) It helps you in developing a better customer service system.
(d) Aids in the improvement of operational efficiency to a great extent.
(e) Through this, you can gain a competitive advantage over your competitors and rivals in your line of business.
Types of Data Analytics
Now, once you know the basics of what is big data analytics, let us look at the different types of data analytics in detail.
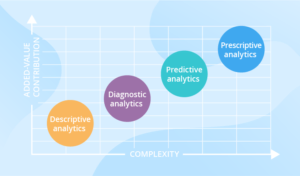
If you want to effectively work with your IT team of analytics or your data scientists, you need to have a clear understanding of the different data analytics technique types.
You also need to know about how you can utilize these techniques in different scenarios to get the actionable insight for making your business succeed. Here are the 5 types of data analytics.
1. Prescriptive Analysis
This is one of the most underused and valuable techniques of big data analytics which you must know about while learning what is big data analytics. It gives a laser-like focus which helps in answering a specific question. It also aids in the process of determining what the best solution is among the varied set of solutions.
Here is an in-depth analysis of why Big Data needs to be taken seriously:
This type of analysis does this by keeping all the parameters into account and gives suggestions for how a future opportunity can be taken advantage of or how a future risk can be mitigated. It also illustrates each and every decision’s implications which in turn improves the decision-making.
The perspective analysis uses the concept of the next best offer analysis and the next best action in order to retain customers. Some features of perspective analysis include,
(a) Forward-looking analysis technique.
(b) Focused on providing optimal decisions for any kind of situation in the future.
(c) It offers simple rules for highly complex models.
(d) Based on differences and similarities, a discrete prediction of the components of a data set can be made.
(e) Decision rules and optimization for events in the future.
2. Diagnostic Analysis
While determining the cause of an event, the diagnostic analysis technique can be of great help to a data scientist. It is a very useful tool when research on usage trends and churn indicators are being carried out.
Analysis of customer health score and analysis of churn reason are a few diagnostic big data analytics examples.
A few features of this type of analysis are given below.
(a) Backward-looking technique.
(b) Focused on analyzing causal sequences and relationships.
(c) The relative ranking of variables or dimensions is based on the explanatory power that is inferred.
(d) The dependant or target variable is attributed to independent dimensions or variables.
(e) This includes Bayesian as well as frequentist inferential analysis.
3. Descriptive Analysis
Descriptive analysis is significantly time-intensive and tends to produce a low value. However, it is pretty useful while the patterns are being uncovered within a particular segment of your customers.
This type of analytics technique will provide a deeper insight into the historical trends and will provide you better ways to dig in to find out more details.
Clustering, summary statistics, and the rules of association used in the analysis based on the market are a few descriptive big data analytics examples. Some essential features are described below.
(a) Backward-looking technique.
(b) Mainly focused on comparisons descriptions.
(c) Used to detect specific patterns and trends.
(d) MECE or Mutually Exclusive and Collective Exhaustive categorization.
(e) Development of categories based on differences and similarities, also known as segmentation.
4. Predictive Analysis
When trying to know more about what is big data analytics, one type of data analysis which receives a lot of attention is predictive analysis. This type of analysis is used to determine the forecast of the results in specific scenarios.
Churn risk, next best offers, and renewal risk analysis are some predictive big data analytics examples. Here a few features of the same.
(a) Forward-looking technique.
(b) Mainly focused on giving out non-discrete predictions of relationships, states, and patterns in the future.
(c) It helps in describing the probability distribution of prediction result set along with likelihood.
(d) Its a form of model application.
(e) Makes non-discrete forecasts which are communicated in the form of probability distributions.
5. Outcome Analytics
Sometimes called consumption analytics, outcome analytics provides a deep insight into the specific outcomes which are driven by customer’s behavior. This type of analysis helps you in knowing your customers in a better way and learn about how your customers are interacting with the products and services provided by you.
Features of outcome analytics are given below.
(a) This technique is backward and forward-looking.
(b) It provides real-time insights into customer behavior.
(c) It provides a description of customer usage thresholds
(d) Form of model application.
What are the Various Tools Used in Data Analytics?
Wondering what is big data analytics tool? Big data analytics tools make the process of data analysis easy and hassle-free. Here is the list of various popular big data analytics tools that are used in data analytics.
1. R Programming
It is widely used for data modeling and statistics.
2. Tableau Public
This is free software that can be used to create visualizations, dashboards, maps, etc, by connecting any data source.
3. Python
Python is a scripting language that is object-oriented and supports structured and functional programming methods.
4. SAS
This is a programming language for analytical data manipulation.
5. Apache Spark
This is a data processing engine that is very fast in executing applications in memory and disk.
All your queries regarding what is big data analytics and the relevant concepts have been explained in detail in the above big data analytics tutorial. Employ these techniques in your business processes now to gain desired results efficiently.
Conclusion
To build a successful career in Data Science & Analytics landscape, choose the right Data Analytics Course. Happy Learning of Big Data Applications.