What is Data Wrangling
Data is transforming the world every day. However, it is said that Data Scientists spend nearly 70 percent of the time cleaning and preparing data because not all data out there can be useful in their raw format. In addition, Data Wrangling meaning is often misunderstood. Let me give you a clear definition first.
Data Wrangling is the process of converting and mapping data from its raw form to another format with the purpose of making it more valuable and appropriate for advance tasks such as Data Analytics and Machine Learning.
The Goals of Data Wrangling
- It should provide precise and actionable data to Business Analysts in a timely matter.
- Reduce the time which is being spent on collecting and arranging data
- Enable Data Scientist to focus mainly on analysis rather than wrangling of data
- Drive better decisions based on data in short time span
You have a basic idea about what Data Wrangling is, now let’s look into key steps in Data Wrangling process with basic examples to get you started.
1— Acquiring Data
The first and most important step is, of course, acquiring and sorting data. Or we can say that finding your data to investigate it further might be the most crucial step towards reaching your goal of answering your questions. However, before finding data, you must know the following properties and you must be okay with that, because this is just the start of a tedious process.
Download Detailed Brochure and Get Complimentary access to Live Online Demo Class with Industry Expert.
Not All Data Is Created Equal
Albeit we would like to believe in the truthfulness and quality of data we see, not all data will measure up to our expectations. When first exploring data, you must ask yourself a small set of questions:
- Is the author of source reachable if I have any questions or concerns?
- Does the data appear to be regularly updated?
- Does it come with information as to how It was acquired and what kind of samples were used in its acquisition?
- Is there any other source where you can verify the data?
If your answers to three or more question is yes than you are on the right track, whereas if the answer to one or more question is no than you have to dig a little more into it.
Fact-Checking
Fact-checking your data, although most of the time annoying, is paramount to the validity of your reporting. If you have access to some of the tools such as LexisNexis, Cornell University’s arXiv Project, Google’s Scholar search, and recently introduced Google’s Data Search, you can study what others have studied and used of a project or research. Once you have validated and fact-checked your data, it will be easier to determine its validity in the future.
Where to Find data
It is obvious that you are not going to ring everyone’s telephone to collect data. Just like there are multiple sources to validate your data, there are enormous number of sources from where you can collect your data. Which includes Government data, Data from NGOs, Educational or University Data, Medical or Scientific Data, Crowdsourced Data and so on. Know the best places to find datasets for Data Science Projects.
Now let’s jump to our main step, which is Data Cleaning.
2— Data Cleaning
Cleaning up data is not more of a glamorous task but it is the essential part of Data Wrangling. To become a Data Cleaning expert you must have precision, knowledge of the particular field, and on top of that patience. Yes, Patience.
Moving towards technical side, Python can help you clean your data easily. Assuming that you have basic knowledge of Python, in this chapter we will look at some Data Wrangling with Python.
Data Clean up basics
To perform operations, we need data. Here, we will use the data-set of UNICEF related to child labor. Let me give you a little insight into the data. In the initial data-sets, there are Multiple Indicator Cluster Surveys (MICS). These surveys are household-level surveys performed by UNICEF workers and volunteers to help research the living conditions of women and children throughout the world. In looking through the latest surveys, we pulled some data from Zimbabwe’s latest MICS to analyze. You will find the updated .csv here.
Identifying Values for Data Cleanup
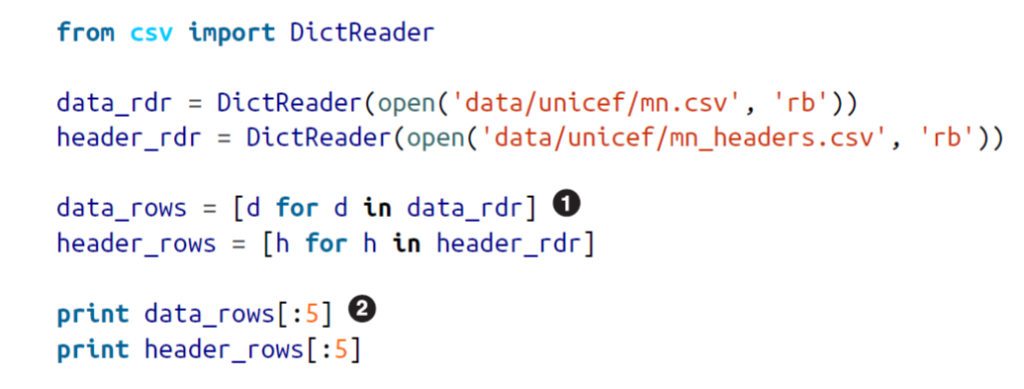
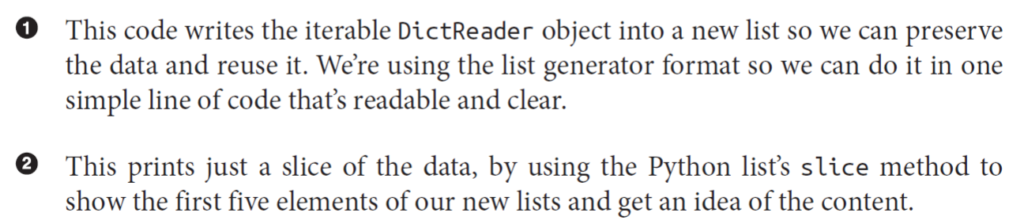
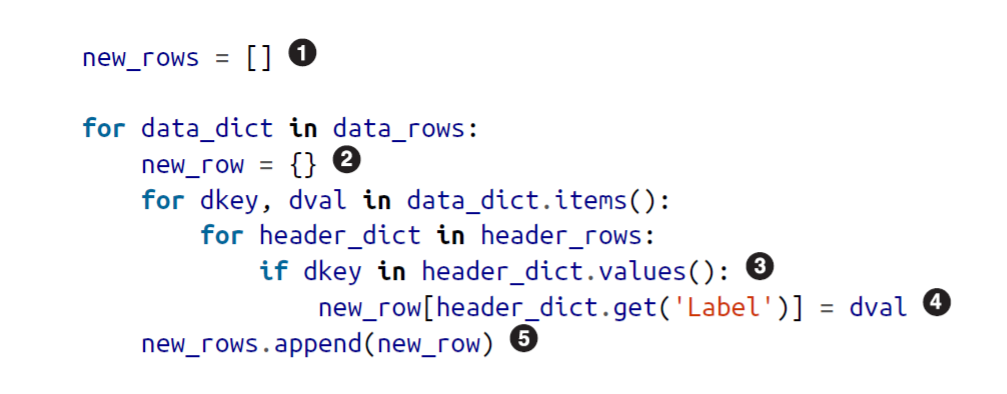
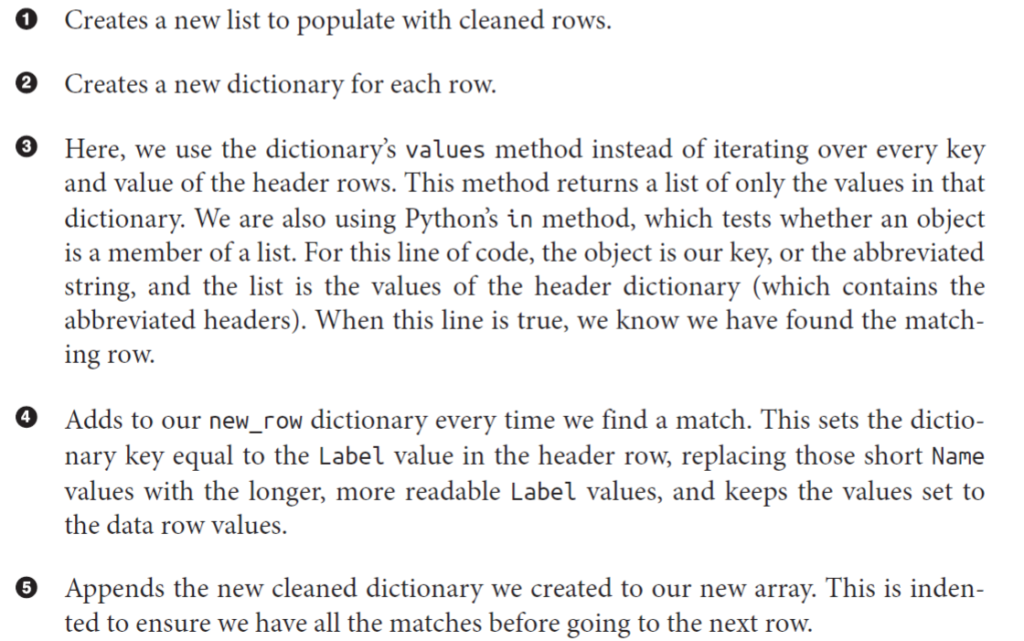
From the given repository link, let’s look at mn.csv file. The file has raw data and uses codes as headers which looks something like this,

Each of these represents data or question in the survey. However, it is not so readable friendly. With some web scrapping skills, and a little Data Wrangling with R, you can have another csv which contains headers with its English variant. You will find this file under the same repository(mn-headers.csv). Below is the code for replacing headers and desired output we need in order to move ahead.
Formatting Data
The most common aim of data cleanup is getting your unreadable or we can say hard-to-read data to fin in proper readable format. Python provides us a ton of ways to format strings and numbers. We used %r, which shows the Python representation of the object in a string or Unicode to debug and show our results.
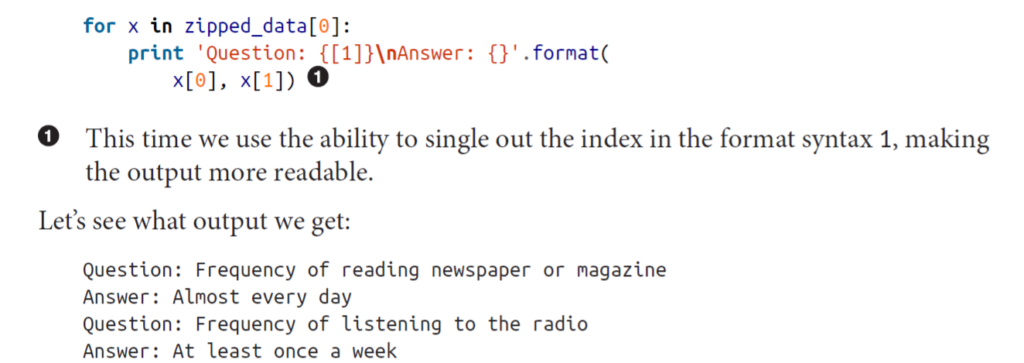
Python also has string formatters %s and %d, which represent strings and digits, respectively. We often use these with the print command. There is a advanced way is the format method of Python, which according to the official documentation, lets us define a string and pass the data as arguments or keyword arguments into the string. Let’s take a closer look at format.
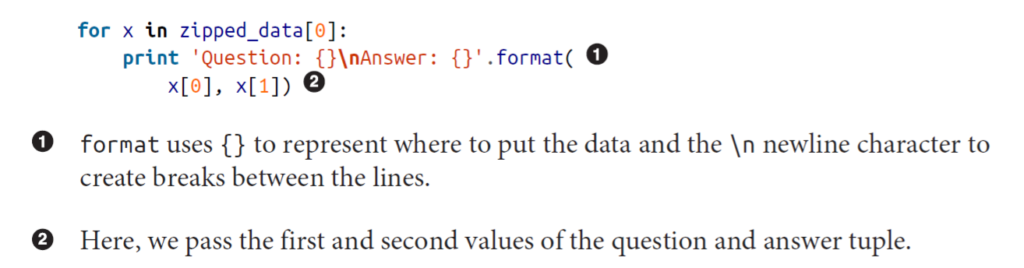
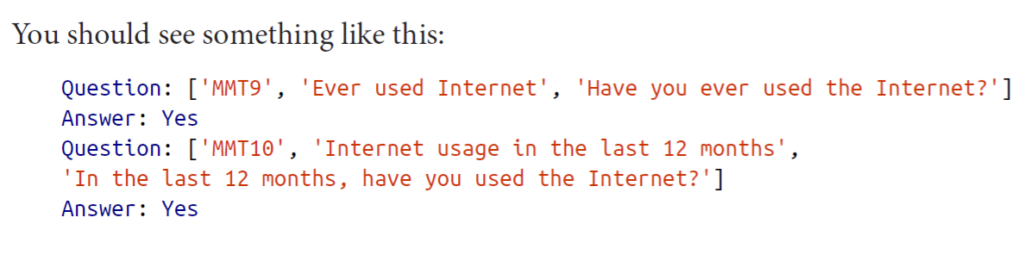
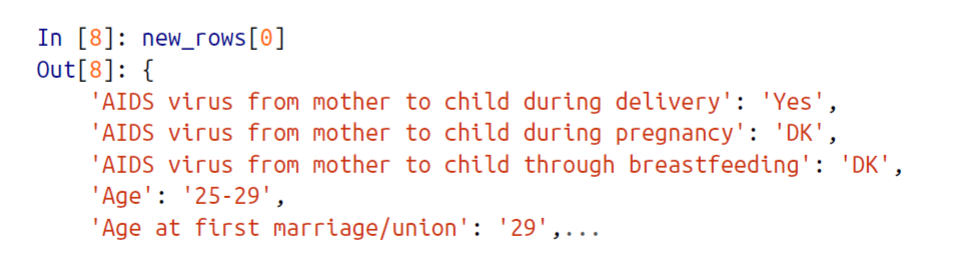
I admit that this is fairly difficult to read. Want to make it more readable by cleaning up a bit? Let’s do it. At the 0-index we can see there is an abbreviation and at 1-index there is a description of the question. We just want the second part, so here it is,
Now the output is fairly readable and easy to understand. Hooray.
Finding Outliers
Finding bad data or outliers is probably one of the most difficult tasks. You always have to keep in mind that you need to clean the data and not manipulate it. For example, our dataset of UNICEF survey follows a standard format of questions.
This is a good sign that data is a proper sample. But what if we find that volunteers only interviewed families in urban area and left rural areas, this might result in selection error or sampling error. Depending on your sources, you should determine what biases your dataset might have.
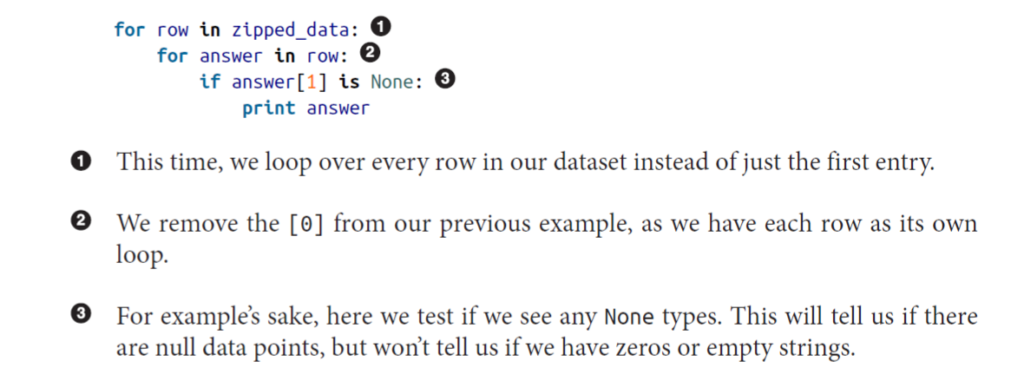
Apart from finding which data bias is used, you can find outliers by simply if-not statements. But they most of the time fails in large data-sets. For example, if we check our entire data-set for missing data by if-not statements, it will look like this. But you will not find any obvious missing data points.
Instead, let’s try to find our data bias NA, which stands for Not Applicable.
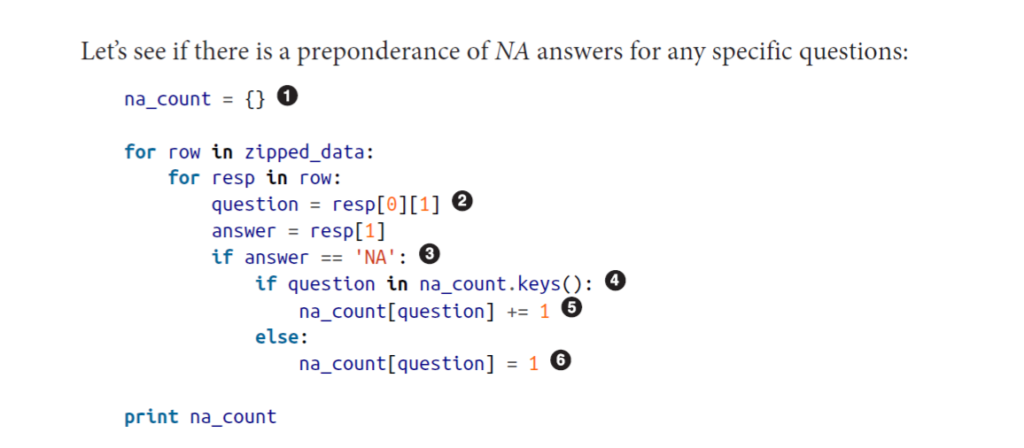
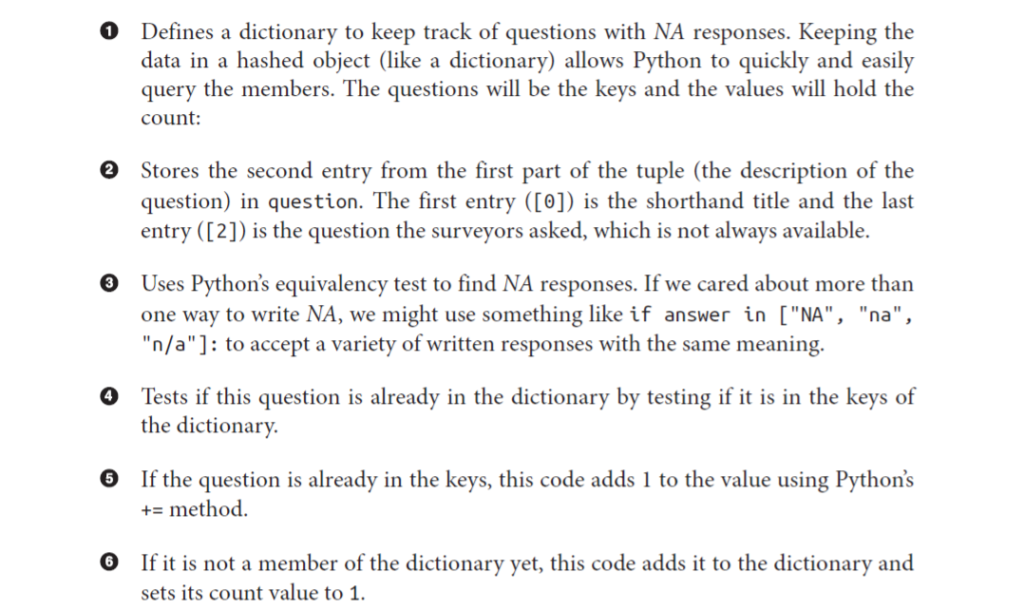
If you are going along with the post you will see there are plenty of NA responses in the data. Did you get an exact number? Tell us in the comments. And now that you have found your outliers, you know what to do. Kick them out. If you know your way around Python, you know it takes only one line of code to replace all the NAS.
Advanced Option
APIs
However fancy it may sound, trust me it’s not. An API is a standardized way of sharing data on the Web. Many websites share data through API endpoints. Some of them, but not limited to, are Twitter, Linkedin, World Bank, US Census.
An API can be as simple as a data response to a request, but it’s rare to find APIs with only that functionality. Most APIs have other useful features. These features may include multiple API request methods (REST or streaming). Let’s understand that with an example,
For instance, twitter API comes in two forms: REST and Streaming. REST stands for Representational State Transfer and is designed to create stability in API architecture, while some real-time services offer streaming APIs.
End Notes
By now, you must know why Data wrangling is the most important task. Without clean and robust data, there is no Data Science. There is enough information on this page to help you get started. Know how to do Data Wrangling with Python and data wrangling with R and learn from them as well. And if you don’t understand anything or have any doubts, feel free to ask us in the comments. Always happy to help.
Happy Learning!