
Introduction
Did you know that Regression analysis is one of the most used statistical analysis? It provides tremendous flexibility, which makes it useful in so many different circumstances. Regression analysis can unscramble very intricate problems where the variables are entangled like spaghetti.
Regression analysis can handle multiple things such as:
(i) Model multiple independent variables
(ii) Include continuous and categorical variables
(iii) Use polynomial terms to model curvature
(iv) Assess interaction terms to determine whether the effect of one independent variable depends on the value of another variable
In this “What is Regression?” – Regression Tutorial, I will cover what regression analysis is, how regression analysis works, why your organization should use regression analysis, and the types of regression analysis.
There are different types of regression analysis models that you can use. You might be seeing a lot of people talking only about Linear and Logistic regression techniques as these techniques are more popular. But this is not completely true. The choice of the regression analysis technique depends on the kind of data you have for the dependent variable and the type of model that provides the best fit. Each regression analysis technique has a specific condition where they are best suited to apply.
What is Regression Analysis?
So, what is regression analysis? Regression analysis is a statistical method that allows you to estimate the relationship between a dependent variable and one or more predictable variables. Regression analysis helps in determining which factors can be ignored, and which factors matter most. Before diving deep into this method, let’s first understand what these two variables are and what their importance is.
Let’s take an example. Suppose you are a sales manager and you are asked to predict the sales for the next month. You will consider a few factors to predict those numbers, such as competitor’s promoting the same product, a new and improved product coming into the market, weather, etc. These factors are called variables. A dependent variable is one that you are trying to predict such as next month’s sales numbers. In contrast, an independent variable is one that you suspect has an impact on your dependent variable such as weather conditions, competitors promoting the same product, etc.
Download Detailed Brochure and Get Complimentary access to Live Online Demo Class with Industry Expert.
How Does Regression Analysis Work?
Now that we’ve answered the question of – what is regression analysis – let us understand how it works.
To perform regression analysis, you will need to establish a comprehensive dataset that you will use to work with this regression analysis method. To create this dataset, you can conduct a survey to your audiences of interest that includes questions addressing all the independent variables that you are interested in.
Step 1. Plotting Data on a Chart
After you have created the dataset, you will need to plot these data points on a chart. Plotting your data is the primary step in determining if there is a relationship between these two variables. After plotting the data points on a chart, the chart will look like this.
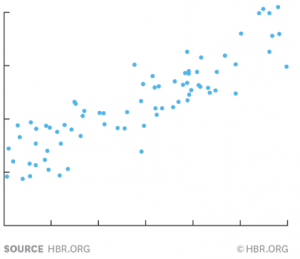
In this example, we are taking rain as a factor to predict the sales numbers. Y-axis represents the dependent variable, i.e. sales numbers, and X-axis represents the independent variable of rain. The blue dots in the above diagram represent one month’s data, i.e. how much it has rained in the respective month and what the sales numbers were in the same month.
Step 2. Building a Regression Model
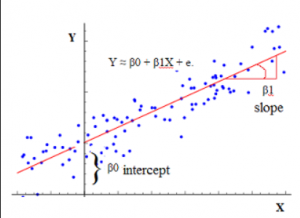
To find out the relationship between the independent variable and dependent variable, draw a line through the chart that runs roughly through the middle of all the data points. This line summarizes the relationship between X and Y.
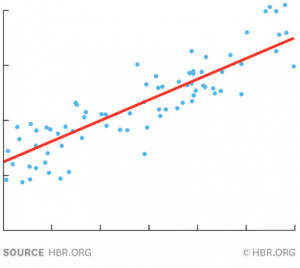
The red line shown in the chart above tells us the degree by how much you usually sell when it rains a certain amount. This red line is commonly called the regression line, and it can be precisely calculated using a standard statistics program like Excel.
The formula for a regression line looks like this:
Y = 100 + 4X + error term
Error term represents that regression is not precise. The formula explains that if there is no X (independent variable), then Y is 100. As per our example, if there is no rainfall in a month, the sales numbers are 100. Since we have taken 4X in the above formula, this explains that if X goes up by 1, then Y will be increased by 4.
A regression line has an error term because independent variables are never precisely perfect predictors of dependent variables. The line is just an impression of the data that you are using for regression analysis. So, the larger your error term, the less definitively certain your regression line is.
This example uses only one factor, i.e. rain, to predict the sales numbers. But you can include all the other factors that have an impact on the sales numbers and keep doing regression analysis until the error term is very small.
What is Regression Analysis, and is it a Correlation?
Again, what is regression and is it related to correlation analysis? Regression and correlation analysis are related to each other as they both deal with the relationship between a dependent and independent variable. However, regression analysis is not correlation analysis and vice versa.
Correlation analysis helps us in determining the association or absence of the relationship between a dependent and independent variable. However, regression analysis determines the value of the dependent variable based on the value of the independent variable.
Regression analysis indicates the nature of the relationship between the variables. On the other hand, the correlation coefficient does not indicate the nature of the relationship (cause-and-effect) between the dependent and independent variables. With a correlation coefficient, you cannot predict that one variable is the cause, and another variable is the effect.
Why Should Your Organization Use Regression Analysis?
In this “What is Regression?” – Regression Tutorial, we’ve covered a broad range of questions. But here’s the most important one – why should your organization use regression analysis?
Regression analysis a method that is utilized to assess the strength of the relationship between dependent and independent variables and for modeling the future relationship between them. By doing regression analysis, companies can determine valuable and actionable business insights (for example, what will be sales numbers in the next 12 months?). Regression analysis helps an organization to understand what their data points represent and how to use these data points for better decision-making. Regression analysis offers a deep insight into how the typical value of the dependent variable changes in the case where one of the independent variables is varied, while the others are fixed.
Here are some of the purposes for which an organization uses regression analysis:
· Decision making
· Business optimization
· Predictive analysis
· Risk analysis
· Understanding the failures
What Is Regression Coefficient?
We’ve understood what is regression, how it works, why your organization should use it etc. Now let’s examine the answer to a popular query by learners – what is regression coefficient? The regression coefficient is an entity that measures the relationship between a dependent and independent variable. It predicts the change in the value of the dependent variable when the value of the independent variable is changed (determines the slope of the regression line). Therefore, the regression coefficient is also known as a slope coefficient.
For example, if your regression line equation is Y = 5X + 10
Then, +5 is the regression coefficient, X is the predictor, and +10 is the constant.
The positive and negative sign of the regression coefficient determines the direction of the relationship between a predictor variable and the response variable.
· If the regression coefficient value is positive, it means that if the predictor variable (X) increases, the response variable (Y) also increases.
· If the regression coefficient value is negative, it means that if the predictor variable (X) increases, the response variable decreases (Y).
For example, in the above equation, if a regression coefficient value is +5, the response variable increases by 5 for every one-unit change in the predictor variable.
Types of Regression Analysis Techniques
The selection of the regression analysis technique depends upon three metrics: number of independent variables, type of dependent variables, and shape of the regression line.
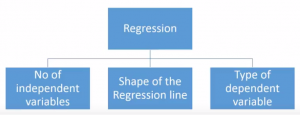
Based on the above metrics, most of the commonly used regression analysis techniques are:
1. Linear Regression
2. Logistic Regression
3. Polynomial Regression
4. Stepwise Regression
5. Ridge Regression
6. Lasso Regression
7. Elastic Net Regression
What is Linear Regression in Machine Learning?
Let’s examine linear regression in this ‘ “What is Regression?” – Regression Tutorial now.
Linear regression is a commonly used type of predictive analysis in statistics and machine learning. It is a technique in which the dependent variable is continuous, and the relationship between the dependent variable and independent variables is assumed to be linear.
Linear regression is one of the machine learning algorithms that is based on supervised learning and acts as a base to build on and learn other machine learning algorithms. In machine learning, this is used to predict the outcome of an event based on the relationship between one dependent and one or more independent variables obtained from the dataset.
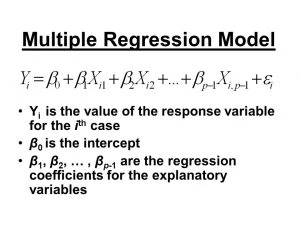
Multiple linear regression is an extension of ordinary least-squares (OLS) regression analysis that uses multiple variables to predict the outcome of a dependent variable successfully.
The equation for multiple regression is:
Simple linear regression finds the relationship between two continuous dependent and independent variables. If one variable can be perfectly expressed by the other, then the relationship between these two variables is called deterministic. For example, we can easily predict the Fahrenheit value if we have been provided with temperature data in degree Celsius.
But simple linear regression looks for a statistical relationship that is not accurate in determining the relationship between two variables. For example, if we have been provided with the height of a person, it is not possible to predict the weight of the same person.
The idea behind using simple linear regression is to obtain a regression line that best fits the data. A regression line is said to be the best fit if the total prediction error (all data points) is as small as possible.
In simple linear regression as well, we tried to plot the data on a chart and obtain a line that models the data points the best.
The regression line in the above graph can be modeled based on the following equation:
Y = a_0 + a_1*x
There are two key factors that you must understand before we dive deep into linear regression.
1. Cost Function
The cost function, also known as the Mean Squared Error (MSE) function determines the best possible values for a_0 and a_1. These values provide the line that best fits the data points. To find the best values, we will convert the search problem into a minimization problem that will minimize the error between the predicted value and the actual value.
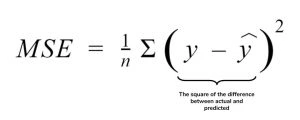
Here, we square the error difference and sum over all data points and divide that value by the total number of data points to obtain the average squared error. The cost function is also known as the Mean Squared Error (MSE) function. Then, we will change the values of a_0 and a_1 such that the MSE value settles at the minimum.
2. Gradient Descent
Gradient descent is an approach to update the values of a_0 and a_1 such that the MSE value settles at the minimum. To find gradient descent, we take partial derivatives for a_0 and a_1 that are used to update a_0 and a_1 value. The idea is to start with random a_0 and a_1 value and then iteratively update the values, reaching minimum cost.
Making Predictions with Linear Regression
Predicting with linear regression is as simple as solving an equation.
For example, we want to predict the weight of a person based on that person’s height. Here, weight (Y) is the dependent variable or predictor and height (X) is the independent variable.
The equation will look like this:
Y = B0 + B1*X1
Weight =B0 +B1 * Height
In the above equation, B0 is the bias coefficient, and B1 is the height column coefficient.
Let’s us assume that B0 = 0.1, B1 = 0.5, and height = 182cm. Now, let’s put these values in the above equation to calculate the weight of a person.
Weight = 0.1 + 0.5 * 182
Or weight = 91.1
The above equation can be plotted as a regression line in two-dimensions. We can use multiple values of heights ranging from 100 to 250 centimeters and put them into the above equation to get the weight values. Thus, we will obtain our regression line.
If you want to know more about the common assumptions in linear regression, you should see The Five Major Assumptions of Linear Regressions.
Conclusion
I hope our “What is Regression?” – Regression Tutorial has given you enough information to provide you a basic understanding of regression analysis and how useful regression analysis is for an organization. Though there are different types of regression analysis models, one can always choose the model by checking the family of variables i.e. discrete or continuous.
In this article, I covered what is regression analysis and how to build the regression model. If you are new in the industry, you can learn this regression technique and implement it in your models.
Regression analysis is one of the steps that take you towards data science. If you want to start your journey in data science, then you should also see How to Build a Career in Data Science and enroll in Digital Vidya’s Data Science Course.


This Beginner guide to understanding Regression is nice. I’m also one of them who doesn’t know Regression but this post is really helpful to understand it.
Nice article garima mam , big fan of your articles