The most common question is how to get insights about Google Analytics data and why. What many people do is, they make the mistake of only looking at page views and number of visitors of their respective business and/or product for years and years.
But that is so wrong, and unfortunate because when you have such a powerful and free tool like Google Analytics at your disposal, why not leverage that in order to learn everything there is to learn about your visitors and use the insights to serve your visitors better by evaluating their behaviour and much more.
And this is exactly the reason why we are going to tell you some Google Analytics essentials that you need to know for your business and/or product (you can thank us later). But keep in mind these aren’t the basics, we’re going to step up and talk about advance insights.
Setting Your Goals Is Key
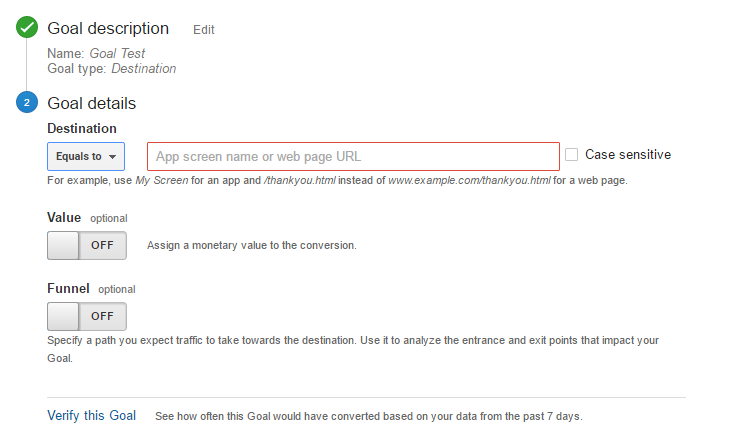
Well this is a very straight forward process, but still it is neglected quiet a lot by majority of business/brand owners. The fact is that after you install the tracking code on your website, the next thing you have to do is set up goals.
Enable Your Site Speed
Site speed is a very good feature of Google Analytics that will let you see the load time of your pages. This feature helps you see which pages of your website need your attention and will help you determine you to look for ways you can speed up the load time of your pages. The reason this is important is it helps you improve your bounce rate by letting visitors have a good experience, this will result in high page ranking.
Connecting Google Webmaster Tools Account
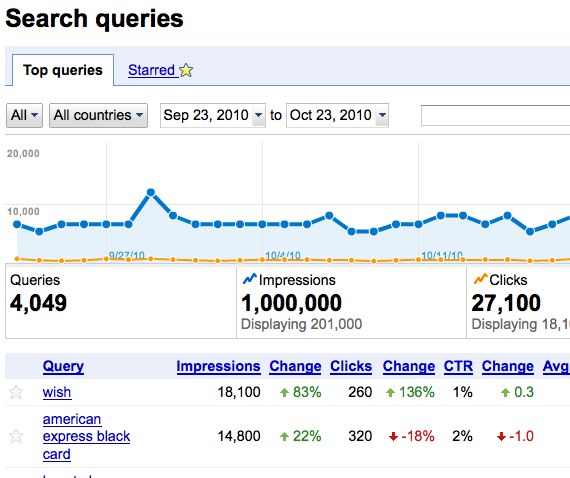
Another free tool from Google, this helps you to see your website data like the number of impressions for your search queries and their position in Google and the number of links to your website information reported by Google after crawling your respective website.
Enable Site Search
Keep in mind, visitors that use search box on your website are more likely to convert than the ones who don’t. The reason behind this is, you’re engaging with your website. This will additionally help you in understanding what consumers are searching for.
Real-Time Reporting
This is a feature that is fairly new and amazing. This displays information about visitors that are visiting your website at that given moment. The report will show you what the active pages that your visitors read and how many active users are on your website pages.
Event Tracking
You can track lots of events through this powerful feature like how many people downloaded your ebooks, which ads are performing better and so on.
This will be possible once you setup the links and setup the event as a goal.
Multi-Channel Funnels
Your go-to feature for understanding conversion rates. With multi-channel funnels you can track the sources that users use to convert like ads, referrals, social media, organic and so on.
For instance, let’s say Maya (the user) landed for the first time from Facebook and subscribed to your newsletter or RSS newsfeed. The next time Maya uses the newsfeed reader to come to your blog and read your articles. Now you know that because she already is familiar with your website she will become a customer.
For a better understanding, take a look at this video:
You Should Use Campaign Tracking
Track online marketing campaigns efficiently, this will help you get past the large number of direct visits that come from URL Shorteners or hootsuite. But in order to do this, tag your URLS correctly with special parameters. You can then add these parameters to your links with the help of Google’s URL builder tool.
Make Custom Dashboards
In the older versions, there wasn’t an option of creating more than one dashboard. Now you can create up to 20 dashboards which are customisable according to your website needs. You can use slick widgets and create custom metrics, pie charts, timelines and tables as well.
Flow Visualization
This is a vast section but we will try to highlight all its benefits. Lets divide this into two sections –
Visitors Flow:
The visitors flow displays the exact path that the user of your business and/or brand have taken to go through the respective website. You can track, based on selection dimensions, for instance country source or keyword and come to the conclusion of the exact path of the users and where they halted or exited and much more.
On hovering you can discover reports for each page and their additional details like the total number of visits, how many people visited specific pages and which pages did they exit the website and so on.
Goal Flow:
This kind of report is good for representing the Funnel Visualization report and it contains the same dimensions as the Visitors Flow Report. Though the main difference between these two is that Goal flow reports doesn’t use all pages but only the steps used to configure the conversion funnel.
And that’s all folks. Let us know if there is anything you’d like to add.