
Let us first understand what Monte Carlo simulation is, and then understand how it was created. The Monte Carlo Simulation is an algorithm (or set of algorithms) used to understand and predict the impact of risk and uncertainty.
The Monte Carlo algorithm relies on repeated random sampling to derive numerical results, and the simulator predicts results giving users a better chance of mitigating risks.
This is why the Monte Carlo simulation is often used in project management, risk, cost, and financial forecasting models.
The Monte Carlo method is mainly used in 3 cases: Optimization, numerical integration, and draw generation from a probability distribution.

The Monte Carlo simulation was derived by mathematician Stanislaw Ulam who worked on the Manhattan Project during World War 2. While recovering from an illness, he was playing solitaires and wondered what would be the chances of a Canfield solitaire laid out with 52 cards to come out successfully.
Download Detailed Brochure and Get Complimentary access to Live Online Demo Class with Industry Expert.
He worked on solving the question and came up with a mathematical solution that he named after the Monte Carlo casinos in Monaco. It is today used to predict the state of uncertain outcomes.
Uncertainties are things we cannot be certain about – this is the standard state for all project work.
How Monte Carlo Simulation Works?
The Monte Carlo simulation is a risk analysis model that works by building models of potential results by substituting a range of values (the probability distribution) for any factor that has inherent uncertainty.
The simulator then calculates results repeatedly by using different sets of random values from the probability functions. The number of iterations depends on the number of uncertainties. The result of a Monte Carlo simulation are distributions of possible outcome values.
The following are some common probability distributions:
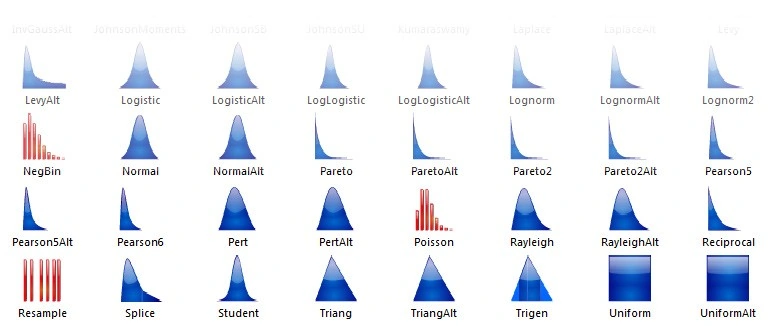
1. Normal
Also called the ‘bell curve’ method, is a method where the user defines the expected value, or mean, and a standard deviation to define the variation about the mean. Resulting values that are nearer the middle (closer to the mean) are most likely to occur. This is a symmetric model and many normal phenomena, like people’s heights, energy prices or inflation, for example, are usually defined by the bell curve.
2. Lognormal
Unlike in the normal distribution, in lognormal distribution, the values are positively skewed. This model is used to represent situations where values do not go below zero but have infinite positive possibilities. Some examples that fit this model include oil reserves, real estate value, etc.
3. Uniform
In the uniform distribution model, all values have the same and equal chance of occurring, and all the user needs to do is define the minimum and maximum threshold. Some examples that fit this model are future sales revenues for a product, manufacturing costs, etc.
4. Triangular
In this method of distribution, the user defines the maximum, most likely, and minimum values and the results are most likely to occur around the most likely value. Some examples that fit the triangular model are past sales values per unit time.
5. PERT
PERT is similar to the triangular distribution model, where the user defines the maximum, most likely, and minimum values and the results are most likely to occur around the most likely value. The difference is that in PERT, the results are more concentrated towards the most likely value and less emphasised around the proximities (max and min values). An example of the use of the PERT model is the definition of the duration of an activity within a project management plan.
6. Discrete
In the discrete distribution mode, the user defines certain specific values and also the likelihood of them occurring. For example, the user defines the results of a lawsuit by stating the chances of a positive verdict are 30%, of a negative verdict are 25%, of a settlement are 40%, and of mistrial are 5%.
Monte Carlo Simulation Example
This Monte Carlo simulation example can be run as a Monte Carlo simulation in excel. We’ll explain what you need to do and give you the steps on how to do it. The Monte Carlo simulation example we will work on will be a game of dice.

In this Monte Carlo simulation example, we are going to consider the rolling of two dice. We will plot the sum result of each turn, and throw both the dice for 10,000 total results. We will then plot the results on a histogram to see the probability of the outcome.
The idea is to keep the randomness of a dice throw, and to see what the simulator predicts as possible. This is an extremely diluted version of a Monte Carlo simulation, as in reality, there are many variables that can each take up many different possibilities making the algorithm much more complex.
But this Monte Carlo simulation in excel will help you understand the working of the model.
Step 1: Simulate a Single Dice Roll
Let us first understand how to simulate a dice roll in excel. The idea is to be able to generate a number between 1 and 6 (because that is the minimum and maximum value on a single dice) at random.
We will use the ‘RANDBETWEEN’ function to achieve this. Typing in ‘RANDBETWEEN(1,6)’ will generate a random number between 1 and 6 within a cell. Hitting F9 will refresh it, in case you need to refresh the number. The RANDBETWEEN function generates numbers at random, simulating the luck of a dice roll.
First type in RANDBETWEEN(1,6) in one cell. You will see a randomly generated number:
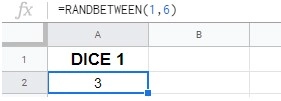
NOTE – RANDBETWEEN refreshes every time the sheet refreshes.
You can also use the ‘ROUND’ as well, like this: ROUND(0.5+6*RAND(),0)
Now, paste this formula on to 10,000 cells in the same column. This will essentially generate 10,000 random numbers between 1 and 6. Congrats! You have simulated 10,000 single dice rolls. Again, these numbers might refresh as you make changes to the sheet, which is the normal functioning of the RANDBETWEEN function.

Let us first build a Monte Carlo simulation with just this data to see how it works. The idea is to find out how many times each number (between 1-6) occurred and then plot it. Use ‘COUNTIF’ to count the number of times each individual number occurs in the result. Now, generate a histogram using the generated results:

You can see the most basic form of a Monte Carlo simulation in action, with a probable prediction of the chances of a number being rolled. We can use this graph to predict how often a number will be rolled.
A similar experiment by engineering.com showed that having a higher number of simulations improves the prediction. This shows that having smaller sample data can lead to false predictions in some cases:

Scores when rolling a dice 100 times

Scores when rolling a dice 1,000 times

Scores when rolling a dice 10,000 times
The images indicate that the prediction gets better and more reliable with higher iterations and samples of data. You might want to keep this in mind when building a more complex Monte Carlo program.
Step 2 – Simulate the Results for Rolling 2 Dice
Now that you know how to simulate a dice roll in excel, you can copy the formula over to column 2 to simulate another dice. We will then have two separate columns with random values between 1 and 6, simulating the results of rolling 2 dice.]
Step 3 – Predict the Result
Now, in column 3, get the sum of both dice per turn. Use the SUM() function to add the integers. Paste this formula over to the 10,000 rolls, and we will have a simulation of the sum of 10,000 rolls of 2 pieces of dice.
You can then correct the COUNT column to recount for values between 2-12 (since the minimum possible sum is now 1+1=2 and the maximum possible value is 6+6=12) and generate a new histogram. It is very often the bell curve model like shown below:

This makes sense as the sum ‘7’ has the highest number of possible permutations: 1+6, 2+5, 3+4, 4+3, 5+2, and 6+1, so 6 permutations. The immediate next digit, ‘6’, will have one less possible permutation: 1+5, 2+4, 3+3, 4+2, and 5+1, so 5 permutations. Hence 7 has the highest chances of popping up as a sum, and thus the bell curve model.
If you want to further experiment with Monte Carlo simulation in excel, check out this Monte Carlo simulation in excel video to get a deeper grasp of how to execute it.
Applications of the Monte Carlo Simulation in Different Fields
Now that you have a good idea of what is Monte Carlo simulation, let’s see how it’s applied in various domains and areas of work.
1. Physical Sciences
Monte Carlo algorithms find many uses in physical chemistry, computational physics, and applied fields. They are applied to derive complicated quantum chromodynamics calculations, design aerodynamic forms and heat shields, and also in modelling radiation transport for radiation dosimetry calculations.
2. Engineering
In the field of engineering, Monte Carlo simulations are used for quantitative probabilistic analysis in process design and for sensitivity analysis. Here are some examples of its use:

In the field of electronics engineering, Monte Carlo Simulations are used to analyze the variations between correlated and uncorrelated in analogue and digital circuits.
It is used in the wind energy sector to predict the energy output from a wind farm.
It is used in autonomous robotics in order to determine the position of a robot.
When planning for a wireless network, the design must be planned in such a way as to accommodate different scenarios based on the number of users, their locations, the services they may look for, etc. Monte Carlo simulations are used to generate these user states.
3. Design and Visuals
Monte Carlo algorithms have been used to produce photo-realistic images of 3D models in global illumination computations, and these are used in design, video games, architecture, computer-generated films, special effects, etc.
4. Finance and Business
One of the most important uses of Monte Carlo simulations is in finance and business, for risk analysis and uncertainty predictions.
They are used to predict the results of factors like sales volume, prices, interest rates, etc. The results of these simulations are often the basis for risk mitigation activities, investments, and purchases, and hence play a big role.
5. Artificial Intelligence for Games
One use of Monte Carlo simulations in Artificial Intelligence-enabled video games is to predict the best possible moves in a game through a technique called the Monte-Carlo tree search. It is used in games like Battleship, Havannah, and Tantrix.
6. Computer Graphics
Monte Carlo ray tracing, more commonly called path tracing, is used to render a 3D scene by randomly tracing possible light path samples. It is currently one of the most physically accurate methods for 3D graphics rendering.
Why You Should Learn Monte Carlo Simulation?
Now that you’re clear about what is Monte Carlo simulation, you may be wondering what the use of learning it is, and how it could help your career.
Firstly, if you’re looking to work in a field that can benefit from predicting outcomes, like in project management where risk prediction can be very useful, you stand to gain from learning monte Carlo algorithms.
You will probably have to learn some Data Analytics Tools, like Excel or a programming language like Python to build a program and implement it at work, but in the long run, it will be beneficial.
Monte Carlo simulations are widely used in the field of finance, for investments, predictions, portfolio building, etc. If you’re looking to enter a company in the finance domain, learning how to build a simulator will help you progress in your career.
We have already discussed the other fields that use Monte Carlo algorithms as well. If you’re going to work in any role that will involve analysis, you stand to benefit from learning the Monte Carlo methods.
If you are inspired by the opportunity provided by Machine Learning, enroll in Digital Vidya’s Machine Learning Course today.


If you are going for finest contents like me, only visit this website daily
since it provides feature contents, thanks
In a “complete guide” it might be appropriate to at least mention that there are variance reduction methods that make Monte Carlo more practical in the STEM fields.