Clustering Algorithms are essential aspects of Data Science and every data scientist must be aware of its concepts. Before discussing the top 5 clustering algorithms, we shall briefly see what clustering is and how it helps in Data Science.
What is Clustering?
Clustering is a Machine Learning technique involving the grouping of data points. It is an unsupervised learning method and a famous technique for statistical data analysis. For a given set of data points, you can use clustering algorithms to classify these into specific groups. It results in exhibiting similar properties in data points and dissimilar properties for the different groups.
The Significance of Clustering Algorithm in Data Science
The significance of clustering algorithms is to extract value from large quantities of structured and unstructured data. It allows you to segregate data based on their properties/ features and group them into different clusters depending on their similarities.
Clustering algorithms have a variety of uses in different sectors. For example, you may need it for classifying diseases in medical science and classifying customers in the field of market research.
Download Detailed Brochure and Get Complimentary access to Live Online Demo Class with Industry Expert.
We shall look at 5 popular clustering algorithms that every data scientist should be aware of.
1. K-means Clustering Algorithm
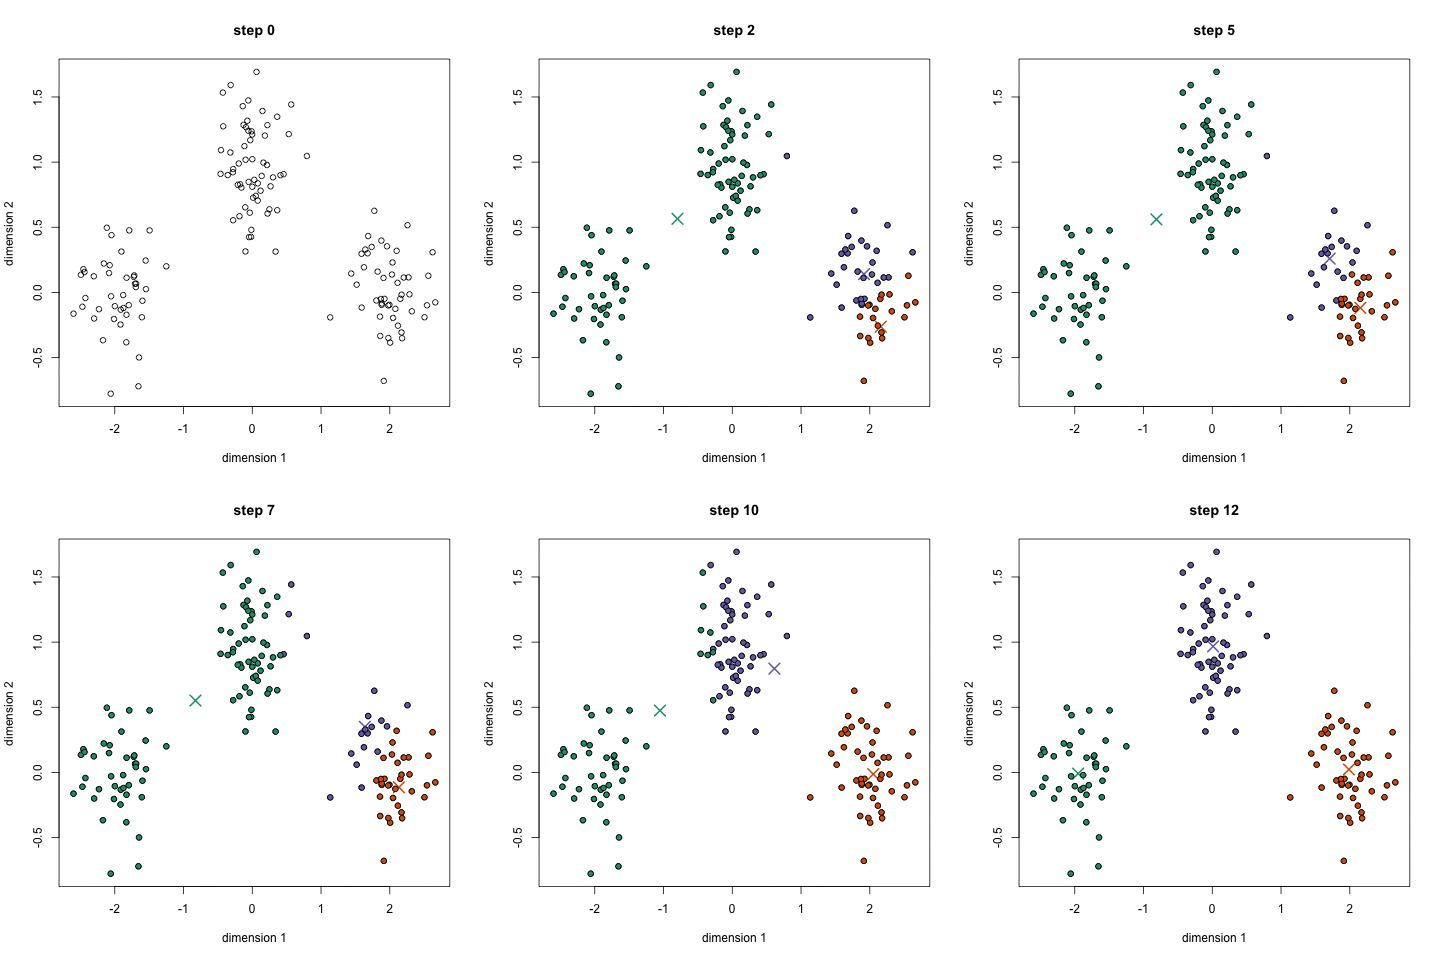
This is the most common clustering algorithm because it is easy to understand and implement. K-means clustering algorithm forms a critical aspect of introductory data science and machine learning. The following graphic will help us understand the concept better.
What do we infer from the graphic?
- Select some classes or groups and randomly initialize the center points. Remember that it is crucial to determine the number of classes you use. Therefore, take a good look at the available data and identify distinct characteristics. The center points, denoted as X in the graphic are vectors having the same length as of each data point vector.
- You classify each data point by calculating the distance between the particular points and each group center. The next step is to classify the point that belong to the group whose center is the nearest to it.
- Based on this information, take out the mean of all the vectors in the particular group and recalculate the group center.
- Repeat the procedure for a number and ensure that the group centers do not vary much between iterations.
Pros
- K-means is a fast method because it does not have many computations.
Cons
- Identifying and classifying the groups can be a challenging aspect.
- As it starts with a random choice of cluster centers, therefore, the results can lack consistency.
2. Mean-Shift Clustering Algorithm
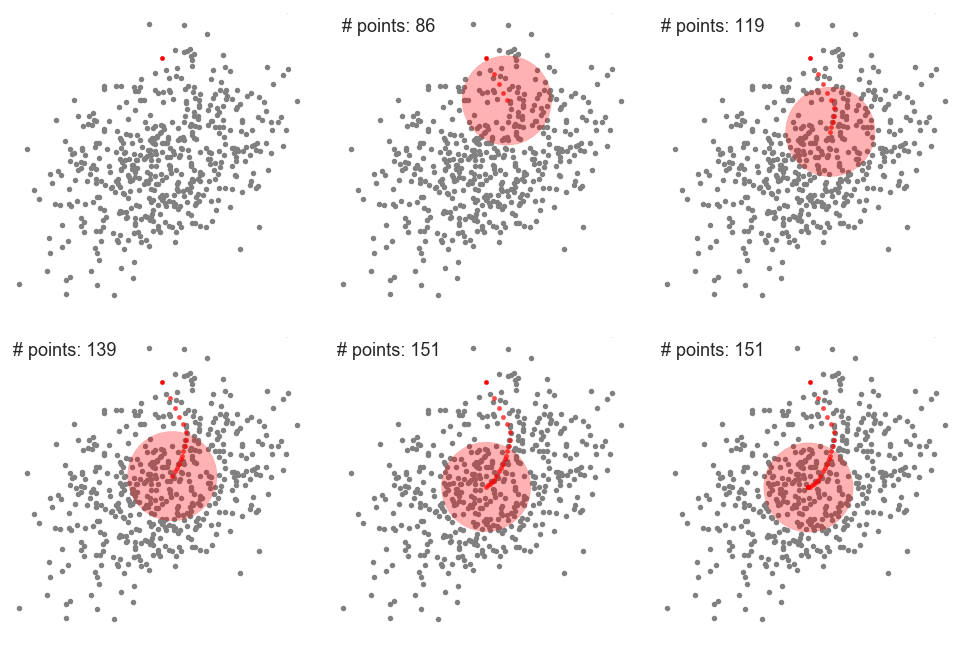
The second type of Clustering algorithm,i.e., Mean-shift is a sliding window type algorithm. It helps you find the dense areas of the data points. Mean-shift Clustering is a centroid-based algorithm with the objective of locating the center points of each group. It works by updating the candidates for the center points as the mean of the points within the sliding window. The post-processing stage is the filtration of the candidate windows. It helps to eliminate the near-duplicates. Therefore, the result is the formation of a final set of center points along with their corresponding groups.
Explanation
- Assume that you have a set of points in two-dimensional space. Begin with a circular sliding window having its center at a randomly selected point, C with radius r as the kernel. This hill-climbing algorithm involves shifting the kernel to an area of higher density on each step until convergence.
- At every iteration, the window shifts towards the denser regions by changing the center point to the mean of the points within the window. Higher the number of points inside the window, the higher is the density within the sliding window. As a result, shifting the mean of the points inside the window entails that the window gradually moves towards the denser regions.
- Continue shifting the window according to the mean until you reach the point where you accommodate the maximum number of points within it.
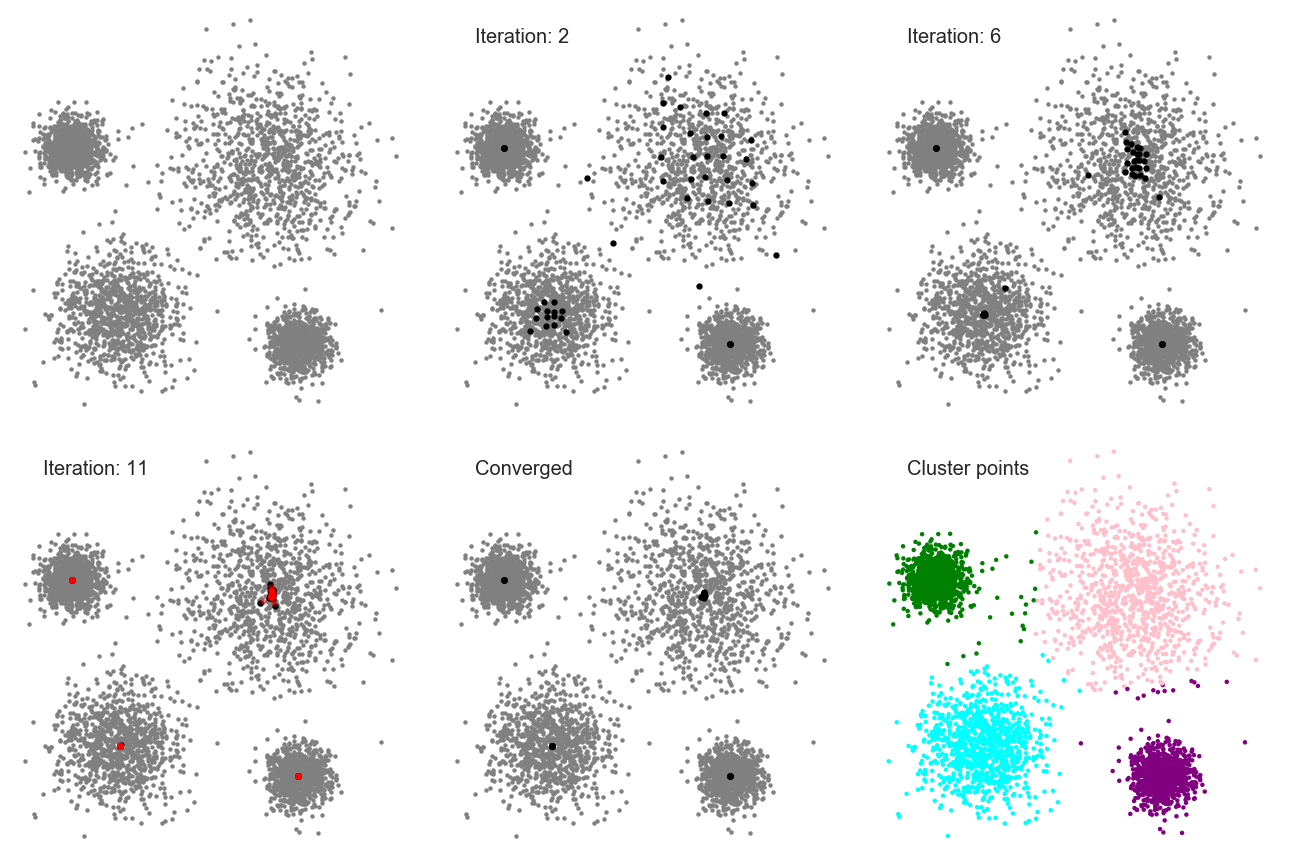
- Repeat this process with multiple sliding windows until you come to a situation wherein all the points will lie within a window. In the case of overlapping of windows, the window having a higher number of points will prevail. Now, you cluster the data points according to the sliding window in which they are present.
The final result will look like this graphic.
Pros
- Unlike the K-means clustering algorithm, you need not select the number of clusters.
- The cluster centers converging towards the point of maximum density is a desirable aspect as it fits well in the data-driven sense.
Cons
- The selection of the window size or the radius t is a non-trivial issue.
3. DBSCAN – Density-Based Spatial Clustering of Applications with Noise
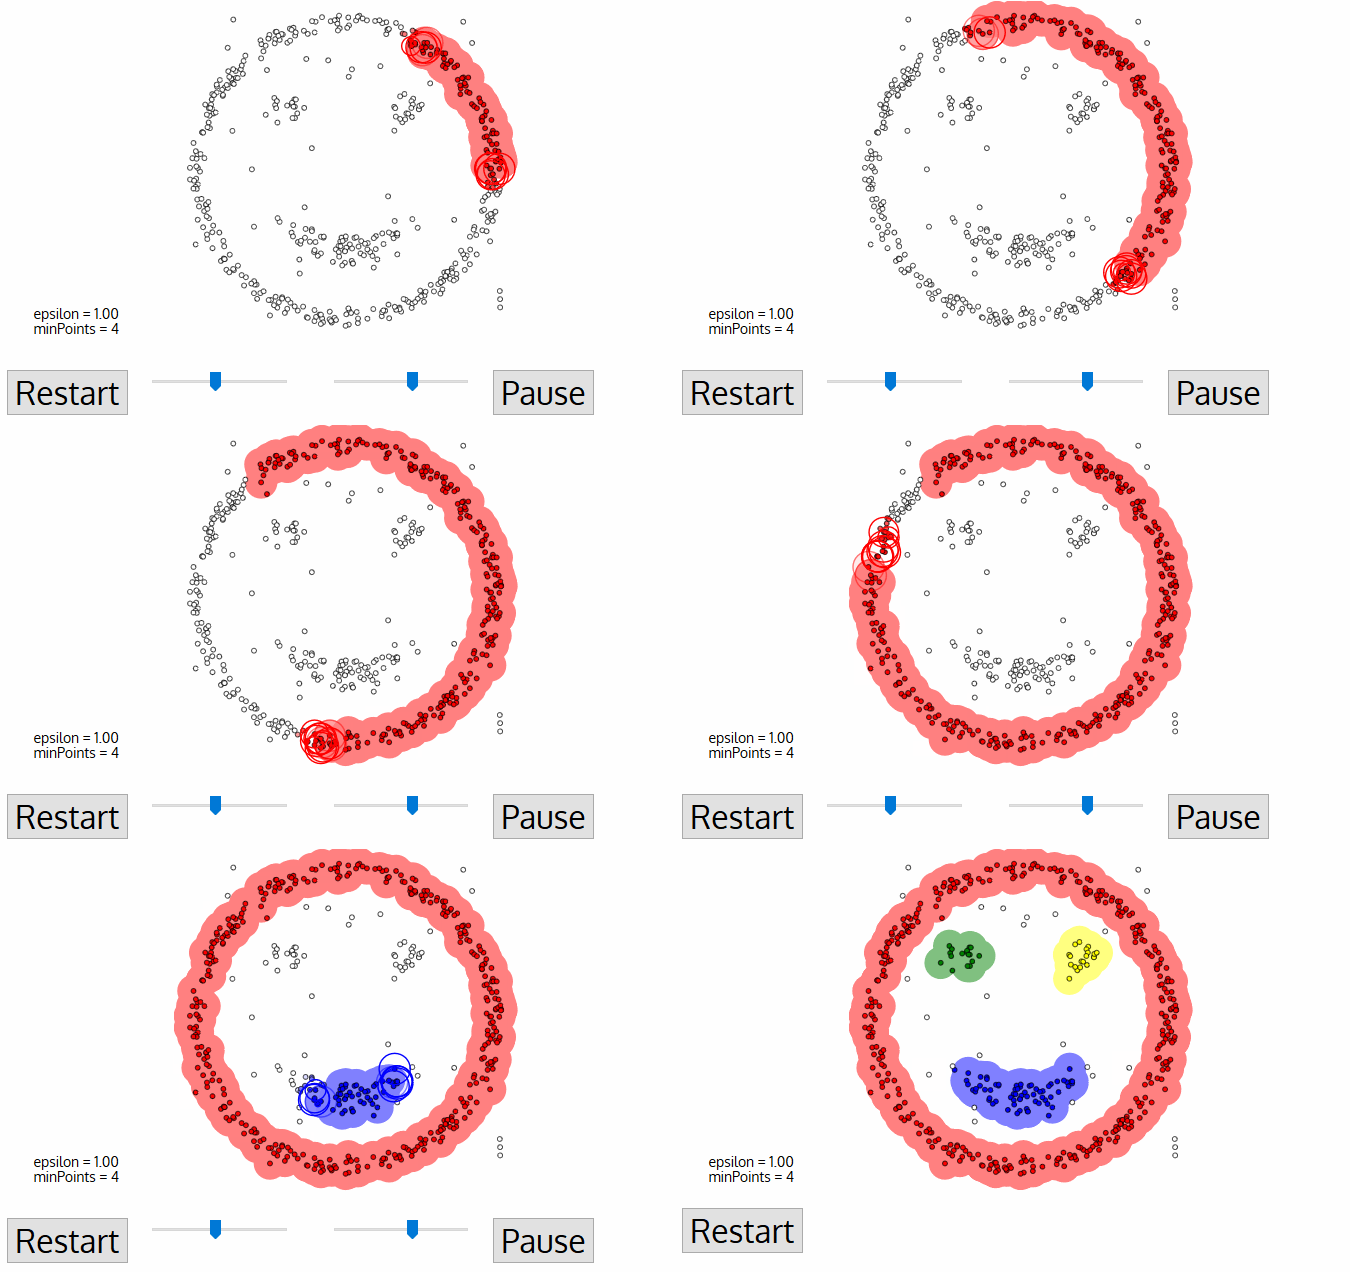
The DBSCAN, a density-based clustering algorithm is an improvement over the Mean-Shift clustering as it has specific advantages. The following graphic can clear out the matter for you.
- It starts with a random unvisited starting data point. All points within a distance ‘Epsilon – Ɛ classify as neighborhood points.
- You need a minimum number of points within the neighborhood to start the clustering process. Under such circumstances, the current data point becomes the first point in the cluster. Otherwise, the point gets labeled as ‘Noise.’ In either case, the current point becomes a visited point.
- All points within the distance Ɛ become part of the same cluster. Repeat the procedure for all the new points added to the cluster group.
- Continue with the process until you visit and label each point within the Ɛ neighborhood of the cluster.
- On completion of the process, start again with a new unvisited point thereby leading to the discovery of more clusters or noise. At the end of the process, you ensure that you mark each point as either cluster or noise.
Pros
- The DBSCAN is better than other cluster algorithms because it does not require a pre-set number of clusters.
- It identifies outliers as noise, unlike the Mean-Shift method that forces such points into the cluster in spite of having different characteristics.
- It finds arbitrarily shaped and sized clusters quite well.
Cons
- It is not very effective when you have clusters of varying densities. There is a variance in the setting of the distance threshold Ɛ and the minimum points for identifying the neighborhood when there is a change in the density levels.
- If you have high dimensional data, the determining of the distance threshold Ɛ becomes a challenging task.
4. EM using GMM – Expectation-Maximization (EM) Clustering using Gaussian Mixture Models (GMM)
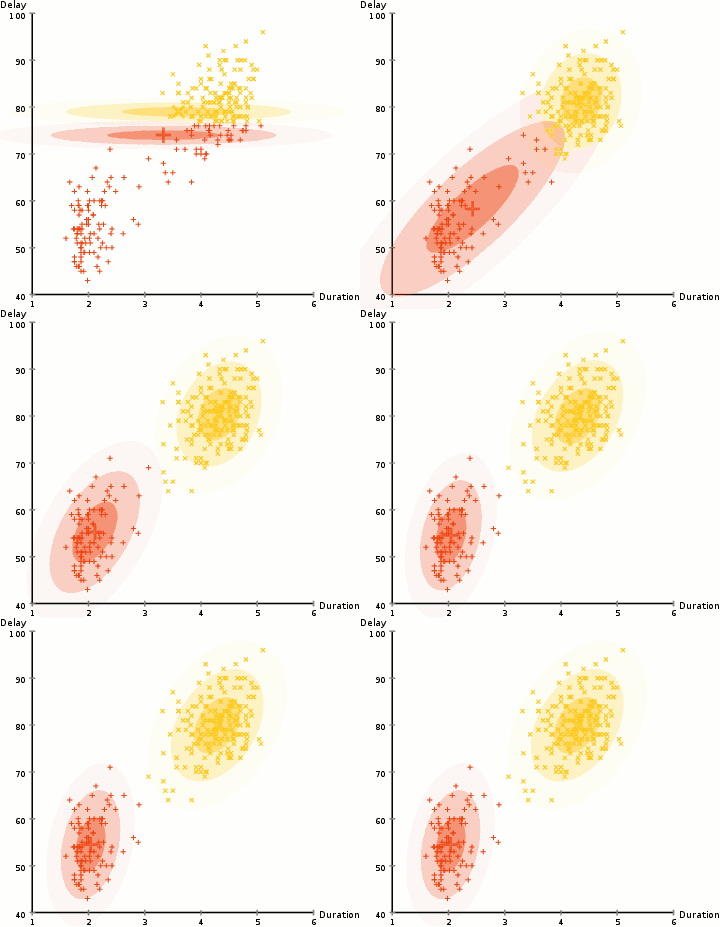
The GMMs are more flexible than the K-means clustering. We begin with the assumption that the data points are Gaussian distributed. There are two parameters to describe the shape of each cluster, the mean and the standard deviation. As we have a standard deviation in both X and Y directions, a cluster can take any elliptical shape. It is not mandatory for them to have a circular shape. Thus, every single cluster has a Gaussian distribution.
We use an optimization algorithm known as Expectation-Maximization (EM) to find out the parameters of the Gaussian for each cluster. The following graphic will explain things better.
- Similar to the K-means cluster, we select the number of clusters and randomly initialize the Gaussian distribution parameters for each one of them.
- With this background, calculate the probability of each data point belonging to a particular cluster. The closer the point is to the Gaussian’s center, the better are the chances of it belonging to the cluster.
- Based on these calculations, we determine a new set of parameters for the Gaussian distributions to maximize the probabilities of data points within the clusters. We use a weighted sum of data point positions to compute these probabilities. The likelihood of the data point belonging to the particular cluster is the weight factor.
- Repeat the steps 2 and 3 until convergence where there is not much variation.
Pros
- There is a higher level of flexibility regarding cluster covariance in the GMMs as compared to the K-means clustering because of the concept of standard deviation.
- As this concept uses probability, you have multiple clusters per data point. Therefore, if a particular data point belongs to two overlapping clusters, we can further define it by saying it belongs A% to Class 1 and B% to Class 2.
5. Agglomerative Hierarchical Clustering
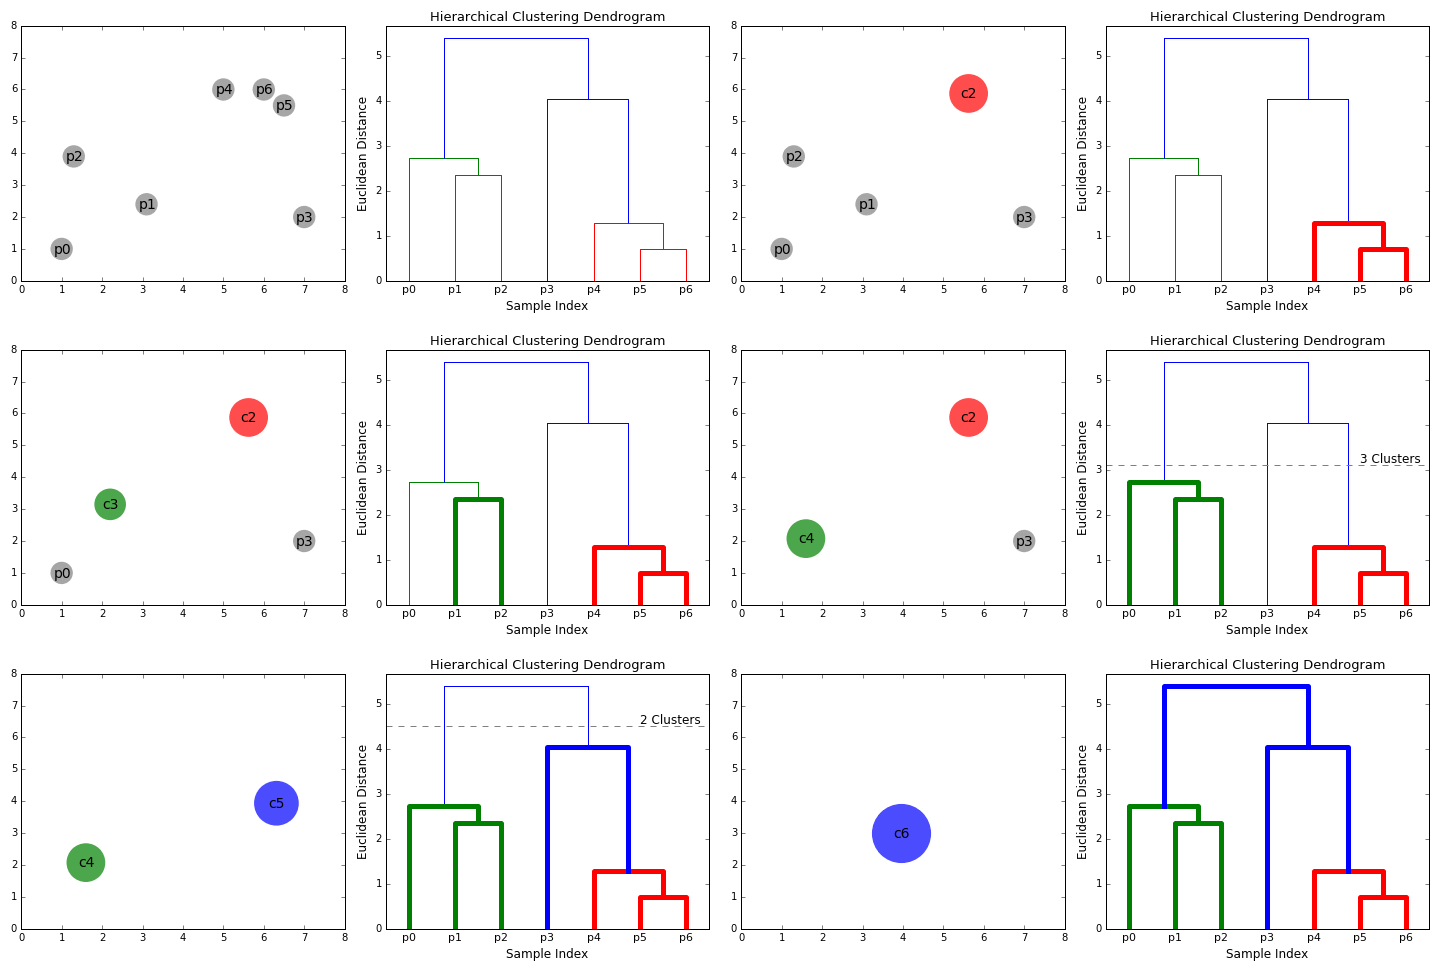
You have two categories of hierarchical clustering algorithms, the top-down and the bottom-up. The Bottom-up concept treats each data point as an individual cluster at the initial stage. It merges pairs of clusters until you have a single group containing all data points. Hence, it is also known as Hierarchical Agglomerative Clustering (HAC). Compare it to a tree where the root is the unique cluster that gathers all samples with the leaves as the clusters with a single sample. The following graphic will explain this concept better.
- Consider each data point as an individual cluster. The second step is to select a distance metric to measure the distance between the two groups. Use the average linkage method where the distance between two clusters is the average distance between the data points in one cluster and the data points in the other.
- At each iteration, we merge two clusters with the smallest average linkage into one.
- Repeat the above step until we have one large cluster containing all the data points.
Pros
- There is no need to specify the number of clusters. You have the option of choosing the best-looking clusters.
- This algorithm is not sensitive to the choice of distance metric.
Best Clustering Algorithms in Data Mining
There are various types of clustering algorithms in data mining. Here are some clustering algorithms in data mining with examples.
- Data Mining Connectivity Models – Hierarchical Clustering
- Data Mining Centroid Models – K-means Clustering algorithm
- Data Mining Distribution Models – EM algorithm
- Data Mining Density Models – DBSCAN
Inference
Many people confuse data mining with data science. You can refer to data mining as a close relative of data science because it works on similar principles.
Clustering algorithms are a critical part of data science and hence has significance in data mining as well. Any aspiring data scientist looking forward to building a career in Data Science should be aware of the clustering algorithms discussed above. These are the five most commonly discussed algorithms in data science. Join the Data Science Using Python Course to elevate your career in Data Science.


Great post.
Hi Rachel,
Thanks for the appreciation.