
According to NASDAQ, the Coefficient of Variation is a measure of investment risk that defines risk as to the standard deviation per unit of expected return. It is not a perfect measure of forecastability.
However, if used in the true sense, it may surely add value to a business’s forecasting process. In the world of forecasting, one of the key questions to consider is the forecastability of a particular set of data.
For example, a salesman might consistently be better at forecasting compared to his or her colleague.
The question that strikes me is: Is it because the data assigned to them is more forecastable, or is the salesman in question more skilled at forecasting?
One of the ways demand planners have tried to answer this question is through the use of a calculation called the Coefficient of Variation (CV).
Some people call it a standardized or normalized standard deviation (StdDev). In this discussion, we will try to answer that question as well.

Coefficient of Variation and MPT
According to Modern Portfolio Theory (MPT), investment risk is defined and measured largely by volatility. MPT further expresses that all investors are rational and operate with perfect knowledge in a perfectly efficient marketplace.
Such investors will not accept a known level of risk/volatility unless they receive a return that precisely rewards them for that risk. This means that all securities sell at a market price that is always equal to fair or intrinsic value.
In this post, we will start with the definition of Coefficient of Variation, its purpose, and then move on to discuss the Coefficient of Variation formula in use, and lastly, its examples. I aim to cover the following in the discussion::
(i) What is the Coefficient of Variation
(ii) Coefficient of Variation formula
(iii) How to Calculate the Coefficient of Variation Formula
(iv) Coefficient of Variation examples

Coefficient of Variation Definition
The Coefficient of variation (CV) may be defined as a statistical measure of the dispersion of data points in a data series around the mean. In other words, the CV represents the ratio of the standard deviation to the mean.
Coefficient of Variation is a useful statistic for comparing the degree of variation from one data series to another, even if the means are drastically different from one another.
The CV helps you find out the extent of variability of data in the sample in relation to the mean of the population. In the finance domain, the coefficient of variation allows investors to determine the extent of volatility, or risk, to be assumed in comparison to the amount of return expected from investments.
It is to be noted that the lower the ratio of the standard deviation to mean return, the better risk-return trade-off. Note that if the expected return in the denominator is negative or zero, the CV could be misleading.
The Coefficient of Variation is also useful when using the risk/reward ratio to select investments. For example, an investor who is risk-averse may want to consider assets with a historically low degree of volatility and a high degree of return, in relation to the overall market or its industry.
Conversely, risk-seeking investors may look to invest in assets with a historically high degree of volatility.
While most often used to analyze dispersion around the mean, quartile or quintile can also be used to understand variation around the median or 10th percentile, for example.
After knowing what is the CV let us move forward to its examples.

Example
For example- Ronny wants to find new investment for his portfolio. He is looking for a safe investment that provides stable returns. He considers the following options for investment:
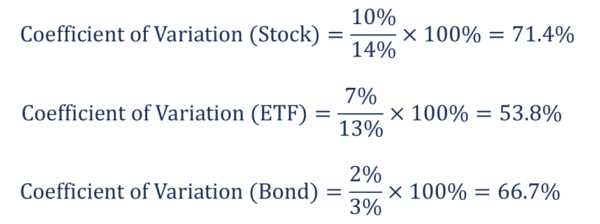
Stocks: Ronny was offered stocks of XYZ Corp. It is an established company with strong operational and financial performance. The volatility of the stock is 10% and the expected return is 14%.
ETFs: Another option is the Exchange-Traded Fund (ETF), which tracks the performance of the S&P 500 index. The ETF offers an expected return of 13% with a volatility of 7%.
Bonds: Bonds with excellent credit ratings offer an expected return of 3% with 2% volatility.
In order to select the most suitable investment opportunity, Ronny decided to calculate the coefficient of variation of each option. Using the formula above, he obtained the following results:
More of the Coefficient of Variation Examples
Based on the calculations above, Ronny wants to invest in ETF because it offers the lowest coefficient (of variation) and the most optimal risk-to-reward ratio.
Examples to take into account
Video on the Coefficient of Variation example:
https://www.youtube.com/watch?v=ZNYCW1LJcKw&feature=youtu.be
Coefficient of Variation Formula
Mathematically, its standard formula may be represented in the as follows:

Where:
σ – the standard deviation
μ – the mean
In the context of finance, the CV Formula may be re-interpreted as follows:

How to Calculate the Coefficient of Variation Formula
How to find a Coefficient of Variation in Excel
To calculate the CV in Excel use the formulas for standard deviation and mean. For a given column of data (i.e. A1:A10), you could enter: “=stdev(A1:A10)/average(A1:A10)) then multiply by 100.
How to Find a Coefficient of Variation by hand
You may use the following formula to calculate the CV by hand for a population or a sample.
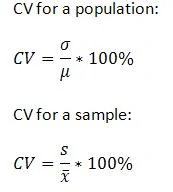
How to find a CV
Where σ is the standard deviation for a population, which is the same as “s” for the sample.
Where μ is the mean for the population, which is the same as XBar in the sample.
In other words, to find the coefficient of variation, you may divide the standard deviation by the mean and multiply by 100.
Easy Steps to create a CV by hand
Sample question: Two versions of a test are given to students. One test has pre-set answers and a second test has randomized answers. Find the coefficient of variation.

Step 1: Divide the standard deviation by the mean for the first sample:
11.2 / 50.1 = 0.22355
Step 2: Multiply Step 1 by 100:
0.22355 * 100 = 22.355%
Step 3: Divide the standard deviation by the mean for the second sample:
12.9 / 45.8 = 0.28166
Step 4: Multiply Step 3 by 100:
0.28166 * 100 = 28.266%
Now you can compare the two results using the CV.
Looking beyond the CV
Does the Coefficient of Variation interest you? Lookup for reference matters on CV examples, to know more latest researches on Coefficient of Variation.
Also, read about the different approaches followed by psychologists for applying the Coefficient of Variation formula. Data Science, which has a lot of common with CV has also gained immense importance in the recent past.
Watch out more insightful writings and discussions on Coefficient of Variation, take part in debates and intellectual discourses to enhance your knowledge.
Check out informative videos that take you through Coefficient of Variation formula and its examples. Be a part of the well-known CV communities for regular knowledge updates and share your views on its trends.
Future of CV
Has my post sparked an interest in you about Coefficient of Variation? Does researching about CV intrigue you? Then you should go for a career in the CV research. Coefficient of Variation has immense prospects.
The exponential rise of data has led to an unprecedented demand for Big Data scientists and Big Data analysts. Enterprises must hire data science professionals with a strong knowledge of Deep Learning and Big Data applications.

However, there is a sharp shortage of data scientists in comparison to the massive amount of data being produced. This makes hiring difficult and more expensive than usual.
Know more about the Data Analytics future in India. However, I believe with adequate training and regular study, you can also become a skilled resource and aim for a high-flyer data science professional role.
You might be a programmer, a mathematics graduate, or simply a bachelor of Computer Applications. Students with a master’s degree in Economics or Social Science can also be a data scientist.
Take up a Data Science or Data Analytics course, to learn Data Science skills and prepare yourself for the Data Scientist job, you have been dreaming of.
Coefficient of Variation and Data Analytics
You may also enroll in a Data Analytics Course for more lucrative career options in Data Science. Digital Vidya offers one of the best-known Data Analytics Course for a promising career in Data Science. Its industry-relevant curriculum, pragmatic market-ready approach, hands-on Capstone Project is some of the best reasons for choosing Digital Vidya.
In addition, students also get lifetime access to online course matter, 24×7 faculty support, expert advice from industry stalwarts, and assured placement support that prepares them better for the vastly expanding Data Science market.