
The coefficient of variation is a frequently used term in statistics. In statistics, one cannot take things at face value. The data on hand could reveal one thing, whereas a more in-depth examination could end up revealing something else.
Hence, this definition of statistics has become famous all over the world. “Statistics is like a bikini. The aspects it reveals are interesting, whereas the data it conceals is important.”
In a statistical set of data, there is bound to be dispersion. Some values could be above the mean value and some below it. This dispersion of data around the mean value is known in statistics as a deviation.
Using each of these deviated values, it is possible to calculate the standard deviation. This standard deviation forms the basis of the definition of the coefficient of variation.
What is the Coefficient of Variation (CV)?
The coefficient of variation is also referred to as Relative Standard Deviation. In statistics, you can state that CV is a statistical measure of the dispersion of the data points in a particular series around the mean value.
In simple terms, you can explain that CV is equal to the ratio of the standard deviation to the mean.
The Formula of Coefficient of Variation
The formula of the coefficient of variation is as follows.

Coefficient of variation = Standard Deviation / Mean
You can have it in the simple decimal form or multiply it by 100% to get a percentage value.
The Coefficient of Variation is a useful statistic, as it helps to compare the degree of variation between two or more series of data, even if the mean values are drastically different from one another. This small example should explain things better.
Download Detailed Brochure and Get Complimentary access to Live Online Demo Class with Industry Expert.
Example of Coefficient of Variation
A Quick Service Restaurant owner wants to open a new outlet. There are two territories to choose from. Consider that these places have favorable conditions for opening a restaurant. The choice will now depend on the rental value, and the best option would be to open the restaurant in the territory that has lesser variation in the rentals.
The data available to us is as follows.
|
Territory A |
Territory B |
| Average Rental is around Rs 120,000 | Average rental is around Rs 200,000 |
| Standard Deviation is 2,000 | Standard deviation is 3,000 |
| Co-efficient of Variation = 2000/120000 = 0.016 or 1.60% | Coefficient of variation = 3000/200000 = 0.015 or 1.50% |
(i) If you look at the rental values, Territory A seems to be a better bet as the average rental cost is considerably lower when compared to Territory B.
(ii) However, it is not the right option because the variation in the rental values is lower in Territory B as compared to Territory A
(iii) The CV of Territory B is 1.50% whereas the CV of Territory A is 1.60%
(iv) Thus, the better option for the restaurant owner is to open the QSR in Territory B.
What does it imply?
The above example proves that a lower value of Coefficient of Variation is preferable because of the lesser degree of volatility.
Thus, the lower the CV, the better is the option. The concept of CV can prove extremely handy when making investment decisions. In the financial world, the CV represents the risk to reward ratio.

Coefficient of Variation (in financial terms) is also referred to as volatility of the investment. Naturally, the investment having a lower degree of volatility is the safer one. Thus, in the investment scenario, the formula of the coefficient of variation should be,
CV = Volatility / Expected Return X 100%
(Volatility represents the standard deviation, and ‘Mean’ refers to the reward or the expected return on the investment)
Consider this simple example that can put things in the right perspective.
Ramesh is searching for a new investment to make. He wishes to play safe, whereby he looks for investments that provide stable returns. His financial advisor places three options on the table.
Stocks
The shares of Company A are available. Ramesh notices that the company is a mature one having a robust operational and financial performance. The expected rate of return is around 14% with the volatility of the stocks being 10%.
Exchange-Traded Fund (ETF)
The financial advisor places the option of investing in the ETF. Ramesh calculates that the expected rate of return is in the range of 13%, but the volatility is less at 7%.
Bonds
Bonds with good credit ratings offer an average return of 3% with low volatility of 2%.
Let us look at what Ramesh does under the circumstances.
Ramesh uses the formula of Coefficient of Variation to get the following results.
Stocks – CV = 10% / 14% X 100% = 71.40%
ETF – CV = 7% / 13% X 100% = 53.80%
Bonds – CV = 2% / 3% X 100% = 66.67%
If you look at the returns, the stocks would seem to be the best option, but the risk level is also the highest. The ETF option offers comparable returns but with a lower degree of volatility. The bonds are the least volatile but the corresponding returns are the lowest, as well.
The formula of CV helps Ramesh make the right investment. There are no incentives for guessing that the ETF option is the one that Ramesh should choose. This option has the lowest risk to reward ratio.
How to Calculate the Coefficient of Variation in Excel
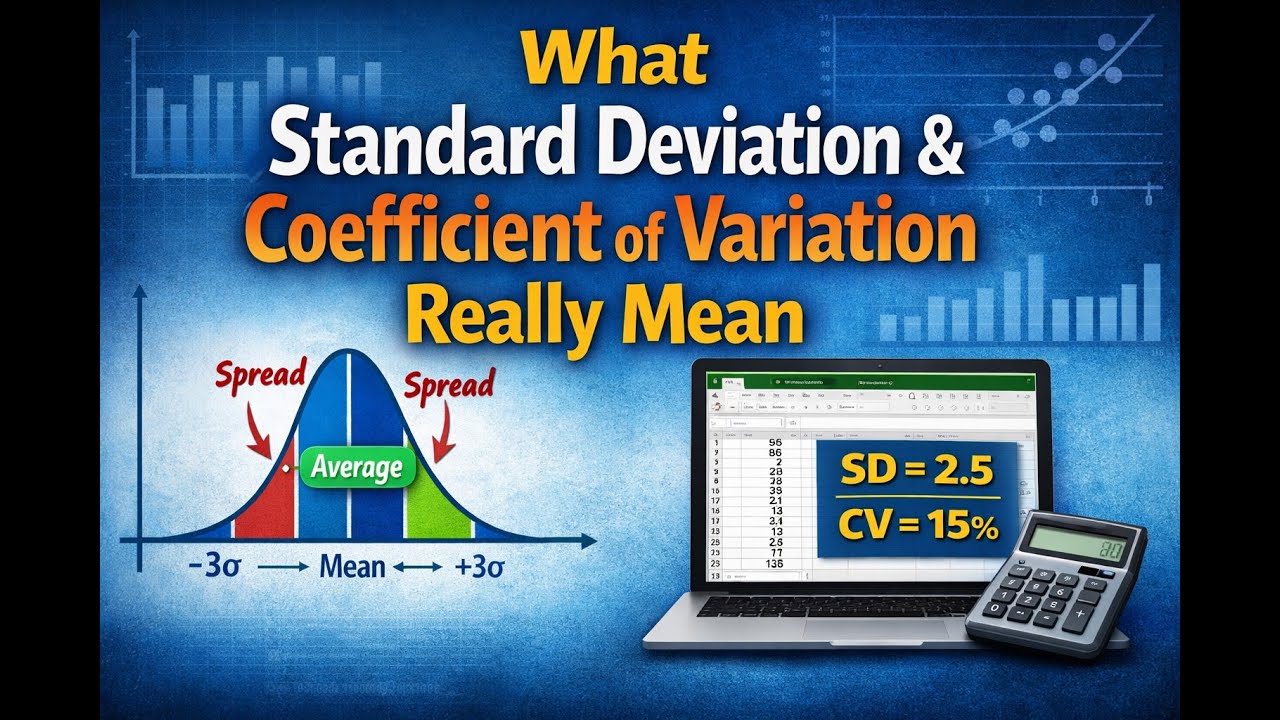
We have seen elementary examples to explain the concept of coefficient of variation. However, in reality, you will never come across such simple calculations. Therefore, one should know how to use MS Excel to determine the formula of the coefficient of variation.
Here is how to calculate the coefficient of variation in Excel.
(i) Assume that you have ten values of data from A2 to A11
(ii) Calculate the average of the ten values using the function ‘AVERAGE(A2: A11)
(iii) Calculate the Standard Deviation of the ten values using the function ‘STDEV(A2: A11)
(iv) The Coefficient of Variation is the ratio between the standard deviation and the average multiplied by 100.
(v) Use this formula to arrive at the CV
Benefits of Coefficient of Variation
We have now seen the concept of coefficient of variation and also discussed the formula of the coefficient of variation. Similarly, we have also seen how to calculate the coefficient of variation in Excel, as well.
We have also studied a couple of examples to understand the applications of the CV under different circumstances. We shall now move forward and discuss the benefits of CV.
1. Measure of Precision
CV helps us to make a precise comparison between different sets of data. If the data sets have the same population, the standard deviation method should be the ideal one to calculate the variation. However, if the comparison is between two different sets of data, the CV provides a better picture.
We have seen the example of the use of CV to decide on the best investment portfolio in an earlier paragraph. In that example, we had three different sets of data, stocks, ETF, and bonds. The concept of CV helped us to focus on the best possible investment option in the example.

2. Measure of Repeatability
The CV is a statistical measure. It helps us to find out the repeatability within a data set and not its validity. In a way, it is more useful to know the degree of association and not its agreement.
The Coefficient of Variation has its importance when you measure the repeatability of data without worrying too much about its validity.
A simple example to highlight the importance of CV is the assessment of measurement error & judge the levels of measurement. Here, the value of CV depends on the variability between sampling units as well as the variability between different readings made by the same user.
If you have different sets of data, the repeatability CV will be higher as compared to the CV calculated for similar sets of data.
Microbiologists use this concept for the evaluation of inter-assay CV and intra assay CV to reduce the CV value and make it acceptable.
3. Data Consistency
The CV is a useful concept to understand the consistency of data. When we refer to consistency, we mean a sense of uniformity within the values present in the data set. The coefficient of variation measures how consistent the different values of the set are from the mean of the data set. The smaller the CV, the higher is the consistency.
Refer to the example of the QSR in one of the previous paragraphs. Consider the Territory A where the mean rental value is Rs 120,000, and the standard deviation is 2000. Therefore, it implies that a significant proportion of the rental costs would be between Rs 122,000 and Rs 118,000.
When we used the formula of coefficient variation, we found out the CV to be equal to 1.60%. Therefore, it shows that the maximum rental values are in the range of Rs 121,920 and Rs 118,080. It enables us to determine the consistency of data.
4. Risk Assessment Indicator
The coefficient of variation is the ideal tool to assess risk. Risk managers love to use this tool more than anything else, as it provides a better indicator for all levels of risk assessment.
We had seen the simple example of investment earlier in the article. Ramesh evaluated the risk associated with each mode of investment using the CV formula. It helped him to deduce that the ETF was the best option available to him even though the returns on stocks were higher.
5. Aids in Decision Making
If you know how to calculate the coefficient of variation, it becomes easy for you to decide on the best options available to you. This concept is useful when a company decides to downsize its activities due to the high cost involved. The company might have to let go of some of its employees. The concept of CV helps to decide which department should face the axe.
This example should help us understand the concept better.
An IT company plans to downsize due to high operational costs. There are two departments on view, for example, coding and billing.
|
Coding |
Billing |
| Number of employees = 40 | Number of employees = 65 |
| Average Salary per employee = $ 450 | Average salary per employee = $ 350 |
| Total Salary for the department = $ 18,000 | Total Salary for the department = $ 22,750 |
| Standard deviation = 7 | Standard Deviation = 9 |
| Coefficient Variation for Coding = 7 / 450 * 100 = 1.6% | Coefficient Variation for Billing = 9 / 350 * 100 = 2.6% |
The Billing department has a higher variability. Hence, it helps the company to decide which department to downsize.

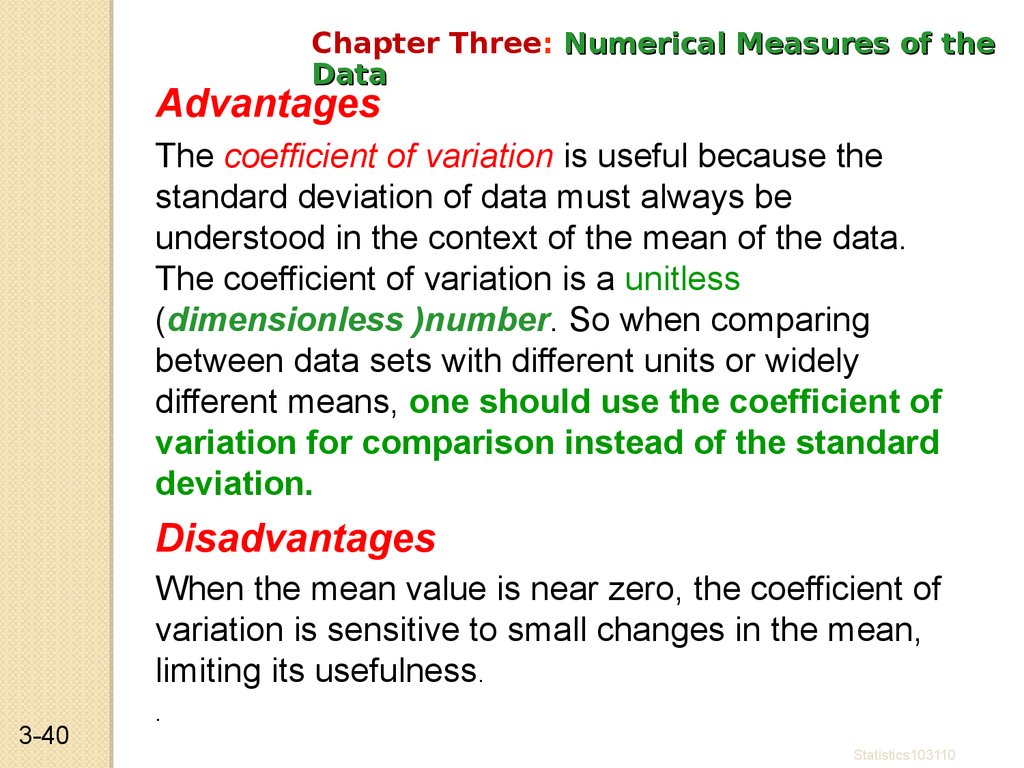
Drawbacks of Coefficient of Variation
As we have gone through the benefits of CV, let us peruse the disadvantages of the concept, as well. It will help to understand better.
1. The Zero Factor – A Significant Disadvantage
The CV is a ratio of the standard deviation to the mean.
The formula for the coefficient of variation says CV = Standard Deviation / Mean * 100%.
Hence, the value of CV depends on both the standard deviation and the mean. If the mean becomes ‘zero’, then CV does not get a finite value. In reality, the mean can be zero at times depending on the sample data. Under such circumstances where the mean is zero, the CV becomes indeterminable.
2. The Logarithm Factor
Similarly, there is no sense in calculating the coefficient of variation of any variable expressed in its logarithmic form. It is because the log of 1 equals zero. Thus, we are only redefining the value of zero.
Standard Deviation Vs Coefficient of Variation
We have discussed a lot about CV and standard deviation. Let us now see the difference between the two concepts using a simple example.
Assume you are a football team selector and want to select one player for the team. You have two options before you. Here are the goal scored statistics for both the players in the last 30 matches they played in.
|
Player A |
Player B |
|
Mean = 60 |
Mean = 48 |
|
Standard Deviation = 18 |
Standard Deviation = 12 |
|
Coefficient of Variation = 18 / 60 * 100 = 30% |
Coefficient of Variation = 12 / 48 * 100 = 25% |
If you go by the standard deviation method, you could end up selecting Player A because A has scored more goals than B. However, a glance at the CV will reveal that Player B has a lower CV of 25% as compared to 30% of Player A.
Thus, selecting Player B should be the ideal option.
Final Thoughts
Standard deviation alone does not help you to make the right decision. The Coefficient of Variation is a critical aspect of your decision-making process. It assumes great significance when it comes to investment matters.
The lower the CV, the less risky is the investment, irrespective of the returns you get. Therefore, the CV concept has tremendous applications in our day-to-day life.
You may also enroll in a Data Analytics Course for more lucrative career options in Data Analytics.