
Are you scheduled for the last minute Power BI interview? Are you confused by a wave of data flowing through google search results when you search for the term ‘power bi interview questions’? Captain Jack Sparrow is here for the rescue. ![]() I have got a rescue boat for you where you will be briefed on the most common Power BI interview questions with answers of course. So take a deep breath and relax and don’t worry about the ocean that is out there. I have tried my best to make the answers efficient and concise so to cover the most important topics related to Power BI. Let’s explore…
I have got a rescue boat for you where you will be briefed on the most common Power BI interview questions with answers of course. So take a deep breath and relax and don’t worry about the ocean that is out there. I have tried my best to make the answers efficient and concise so to cover the most important topics related to Power BI. Let’s explore…
Top Power BI Interview Questions & Answers
Ques.) What is SSBI?
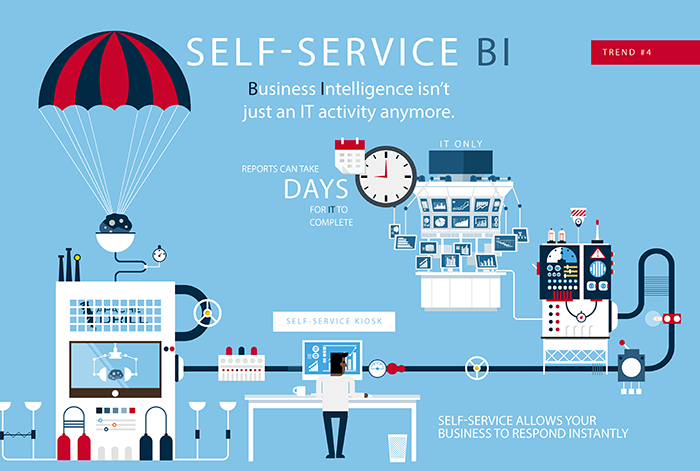
SSBI stands for Self-Service Business Intelligence. It is an access to data analytics that empowers business users to clean, divide, and interpret their data. SSBI has made it simpler for end-users to access their data and create different visuals to get useful business insights. Anybody who has a basic knowledge of the data can build reports to create spontaneous and shareable dashboards.
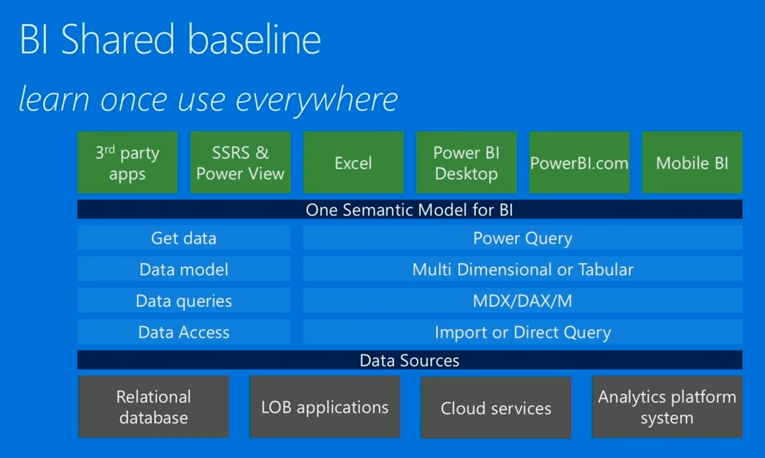
Ques.) What are the parts of SSBI?
Power BI – Power BI is a cloud-based business analytics service. It allows the user to visualize and interpret data with higher rate, performance, and perception.
Excel BI Tool Kit – In the heart of Microsoft’s Power BI is the Excel BI Toolkit. This consists of Excel and four add-ins that allow us to upload, form, develop, and display our analyses. These elements are as follows,
- Power Query – Easily explore, access, and convert public and internal data sources.
- Power Pivot – Perform data modeling for in-memory analytics.
- Power View – Analyze, visualize and illustrate data as an interactive data visualization using Power View.
- Power Map – Bring data to life with interactive geographical visualization.
Ques.) How does SSRS integrate with Power BI?
SSRS stands for SQL Server Reporting Services. Some of its items like charts can be clasped to Power BI dashboard. Selecting the tile in Power BI dashboards will bring the user to the report. A subscription is devised to keep the dashboards tile refreshed.
Ques.) List the name of some filters used in Power BI reports.
Some of the filters used in Power BI reports are as follows:
- Page-Level Filters
- Visual Level Filters
- Drill Through Filters
- Report Level Filters.
Ques.) What is the advantage of Alerts feature in Power BI?
With the power of alerts, we can always know whenever something about some data we care about changes and we’ll be able to jump to it and start learning and getting insights from that as well.
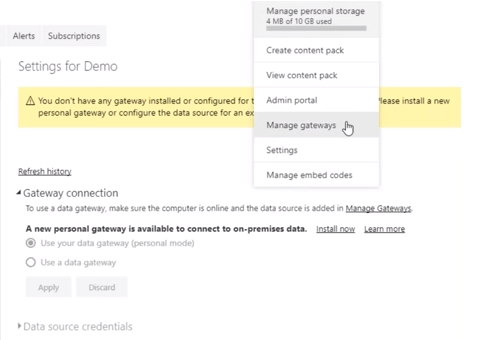
Ques.) Is it possible to refresh Power BI reports once uploaded to Share point or powerbi.com on the cloud?
Yes, we can refresh our reports once uploaded to the cloud. In the case of powerbi.com, we can refresh it via Power BI Personal Gateway and in case of SharePoint via Data Management gateway.
Ques.) If you have experience in Excel, how can you leverage this experience with Power BI?
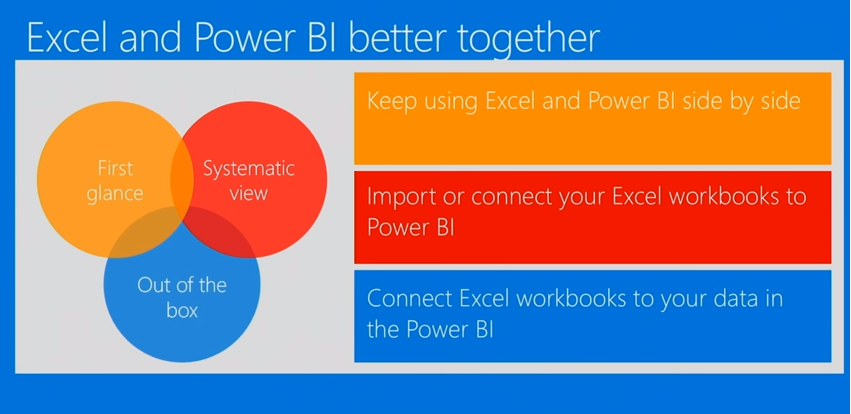
Some ways to leverage the excel experience with Power BI are Personal Gateway, On-Premise Gateway, Power BI Publisher.
With Personal Gateway, the content that connects to your on-prem source (i.e. installed and runs on machines in the building of a company using the software, rather than at a remote cloud or server), you can retain it.
Microsoft Power BI publisher for Excel enables you to take snaps of your most significant insights in Excel. For example, Charts, Ranges and PivotTables. You can also pin them to Power BI dashboards.
For example, I have got an Excel workbook here and within it, I have created a Power Query. My data has got a number of problems with it. Its actually the top smartphones of the year 2017 and I’ve got to extract the configurations and models and GPUs from a couple of columns. What I can do is use all these tools at the top of the screen to create a number of successive transforms and as I apply each transform, the data gradually keeps getting tidier.
The effect maybe isn’t so substantial yet but as I move to the bottom it will begin to look a bit better now and if I click on the final transform the cumulative effect of all the different transforms will create some tidy data. What I can then do is load that into my spreadsheet. I can load it into my Excel sheet or I can load it into my underlying Power Pivot model.
I am actually going to choose my worksheet and It would be brought in the form of an Excel table for subsequent use. But the great thing about Power Query is that it will save the query, so if my underlying data changes all I need to do is rerun my query and I will get the latest data in. Power Query allows you to link not only to lots of different data sources but also to websites as well.
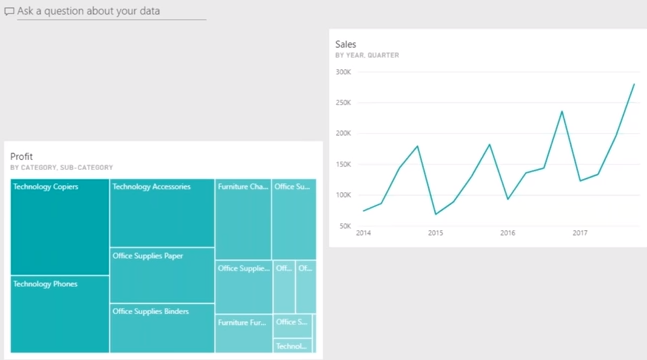
Ques.) What is Power BI Q&A?
Power BI Q&A is a natural language querying tool which helps in finding answers to our questions from our data to get the results we need from it. We do this by typing into a dialog box on our Dashboard, the engine spontaneously produces an answer. Similar to Power View, Power BI Q&A interprets our questions and shows us a related query of what we are looking into our data.
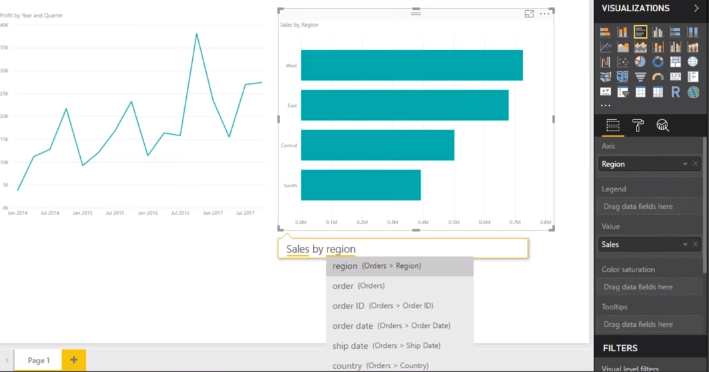
For this to work, a dashboard should be created for your report. On the top of your dashboard, you will see Q&A question bar. To get into a table view you need to type the name given to the set of data. For example, you can type ‘sales’, ‘show sales’ and so on.
‘Where’ keyword can be used to filter values. For example, show sales where the title “The Alchemist”. This will fetch all sales for the book “The Alchemist”.
Ques.) What are many-to-many relationships and how can they be addressed n Power BI?
Many to Many relationships can be used in Power BI. The ‘cross filter’ function can be used in Power Pivot for Excel. DAX can be used to check the metric and optionally alter the filter setting.
Ques.) What is DAX?
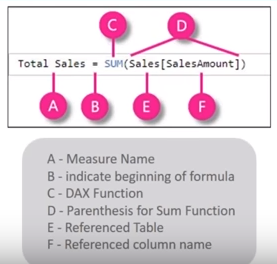
DAX stands for Data Analysis Expression. It lets us do the basic calculation and data interpretation on our data in Power Pivot model. It is a functional language used to measure computed column and computed field.
Ques.) Can you name some data sources that Power BI can connect to?
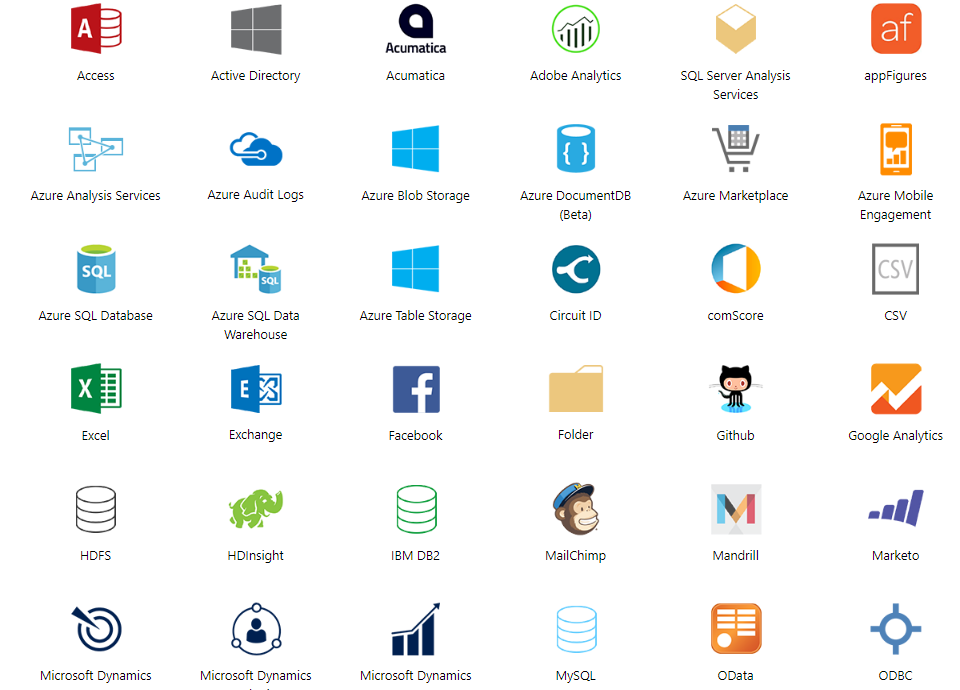
Yes, various data sources that Power BI can connect to are as follows,
- Files – .xlsx or .xlsm (Microsoft Excel) | .pbix (Power BI Desktop) | .csv (Comma Separated Value)
- Content Packs – salesforce.com | Google Analytics | Office 365
- Connector – SAP Business Warehouse Server | Impala | Snowflake
Ques.) What are Power BI components?
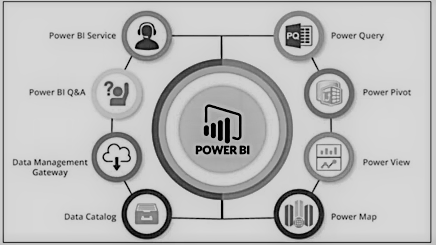
The key components of Power BI are as follows,
- Power BI Service
- Power Query
- Power Pivot
- Power View
- Power Map
- Data Management Gateway
- Power BI Q&A
- Data Catalog
Ques.) Which language is used in Power Query?
The programming language used in Power Query is called M-Code. It is simple to use and similar to other languages. M-code is case sensitive language.
Ques.) What are the benefits of using variables in DAX?
Variables can create more spontaneous DAX expressions which are more logical to interpret. Variables are only scoped to their query, they cannot be shared among queries or be defined at the model level. When we declare and evaluate a variable, the variables can be reused numerous times in a DAX expression, thus avoiding additional queries of the reference or source database.
Ques.) What is Power Pivot Data Model?
Power Pivot Data Model is a combination of Columns, Tables and Table Relations. These data tables are usually formed to contain data for a business entity.
Ques.) What are the most common DAX Functions used?
Some of the most common DAX functions used are as follows,
- IF | AND | OR | SWITCH
- UNION | INTERSECT | EXCEPT
- GEOMEAN | MEDIAN | DATEDIFF
- VALUES | ALL | FILTER | CALCULATE
- ISBLANK | ISFILTERED | ISCROSSFILTERED
- SUM | MIN | MAX | AVG | COUNTROWS | DISTINCTCOUNT
- NATURALINNERJOIN | NATURALLEFTROUTERJOIN | VAR (Variables).
Ques.) What is calculated column in Power BI?
The Data Analysis Expressions (i.e. DAX) which are calculated during the process of refreshing of a model for each row of the said column and can be used like any other column in the model is called calculated column. In case of large tables If the calculated column is not present in the source system, the calculated column can also reduce processing performance. They are not compressed and this consumes more memory and results in reduced query performance.
Ques.) What is the advantage of ‘Calculate’ and ‘Calculatable’ function? What are its limitations?
Advantage – Add to existing filter context of queries. Override filter context from queries. Remove existing filter context from queries.
Limitations – Filter parameters cannot reference a metric and can only operate on a single column at a time.
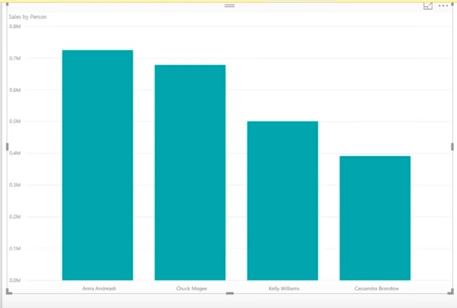
Ques.) List some Power BI Desktop Visualizations.
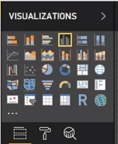
Some of the visualizations that can be found on the visualization pane are as follows,
- Stacked Bar Chart | Stacked Column Chart | Clustered Bar Chart | Clustered Column Chart | Line Chart | Area Chart | Stacked Area Chart | Line and Stacked Column Chart | Line and Clustered Column Chart | Waterfall Chart | Scatter Chart | Pie Chart | Treemap | Table | Funnel | Gauge | Multi-Row Card | Card | KPI | Slicer | Doughnut Chart
Ques.) What is Power Pivot?
Power Pivot helps us to analyze our data in order to make timely business decisions without requiring IT assistance. Power Pivot is a Microsoft Excel add-in that enables us to import very large scale of rows of data from multiple data sources into a single Excel workbook. It lets us create relationships between complex data, creates calculated columns and measures using formula. It lets us create Pivot Tables and Pivot Charts.
Ques.) What is Power BI Desktop?
Power BI Desktop is a free desktop application available to download for Windows operating system. Power BI Desktop works in sync with Power BI service by providing advanced data research, exploration, modelling. It enables us to create reports with highly interactive and beautiful looking visualizations. We can save our work to a file or publish our data reports right to the Power BI server in order to share it with other people throughout the world.
Ques.) What purpose is x-velocity in-memory analytics engine used in Power Pivot?
The main engine behind power pivot is the x-Velocity in-memory analytics engine. It can handle a large amount of data because it stores data in columnar databases and in-memory analytics. Thus resulting in faster processing of data as it loads all data to RAM memory.
—-
Also, check out the youtube playlist of some cool videos by Will Thompson – Program Manager at Microsoft.
Questions and Answers were compiled and re-written from posts published earlier on the topic of Power BI with lots of additional new content not covered previously.
Data Visualization with Microsoft Power BI
Powerful Reports using Microsoft Power BI Reporting Tools
Introduction to Microsoft Power BI (Business Intelligence)
If you are also inspired by the opportunities provided by Data Science and Analytics, enroll in the Data Science Master Course to elevate your career.
Image Credits: Microsoft, MapR