If you have been regularly following my posts on Power BI you may remember in one of my previous posts [wormhole-1], I did briefly talk about using Power BI and Excel together. In this post, read everything you can do in Power BI with Excel 2010/2013 Add-in package. Here is what I will cover. Firstly, I will explain the tutorial on how to download and install Power BI Add-in package for Excel 2010/2013. We will then begin with what is Power Pivot, what it does and how you can use it. Then look at some advantages and disadvantages of using Power Pivot. Then we will see Power Query, how you can use it to extract, transform and load data in Excel. We will also look at creating powerful reports using Excel, looking at the strengths and weakness of them. Finally, we would briefly look at the Power Map, show how you can use it to create maps in Excel.
Excel is the world’s number one tool for data analysis with hundreds of millions of users and it’s available for the users on all platforms on Windows, iOS, Android and Web.
Along the way I will also focus on the unique value of Excel BI things like pivot tables and cube functions, the data grid where everyone is running their simple calculations, data validations and more rich formatting capabilities for charts and tables and of course the object model which everyone with some time on their hands can automate everything and have had a much value out of it. Before we begin you can go into the past real quick and refresh some of the concepts I have covered in one of my old posts [wormhole-2].
Welcome back to the future, let’s get started!
Tutorial: Power BI Add-in for Microsoft Excel
In this section, I will show you how to download and configure the add-in package for Microsoft Excel 2010/2013 to be able to use the Power BI with Excel.
Download and Install Power BI add-in package for Excel
- Goto https://www.microsoft.com/en-in/download/details.aspx?id=39379
- Select a Langauge from the dropdown list and then click on Download.
- Select 32-bit/64-bit version as per your Operating System Configuration (See your’s by navigating to Control Panel\System and Security\System or Right Click on This PC -> Properties
- Click on Next.
After the download is complete, install the Power Query just like you would install any other computer application.
Power Pivot
Power Pivot allows you to pull tables from lots of data sources, link them together and only show in normal Excel view those tables which the user will find of interest.
Power Pivot allows you to create a data model which hides the complexity of the underlying database so the end user who probably is not familiar with databases only sees those tables and columns which actually makes sense to him or her.
Advantages
- It is Quicker – It uses something called X-velocity engine. It used to be called the vertical engine for those who are familiar with names from Microsoft. It basically is Sequel Server and will run more quickly than Excel will
- You are not limited to Excel 1,048,576 row limit. You can basically have as many rows as you like in your tables subject to the amount of memory you’ve got in your machine
- It is more powerful. You can use a language called DAX to create a more complicated calculator field than available in a standard pivot table and these are particularly useful when you’re using data functions. For example, you want to compare this month sales with the same period in the previous years, it’s very easy to do by writing an expression in DAX
- It makes it easier to combine data from lots of different data sources into a single pivot table. So if some of your data come from an Excel CSV file, some come from the clipboard, some come from Access, some come from Sequel Server, then you will find that the Power Pivot is an ideal tool for you
- It allows you to create a data model which hides the complexity of the underlying database so the end user who probably is not familiar with databases only sees those tables and columns which actually makes sense to him or her.
So those are the advantages of using Power Pivot.
Power Query
Let us look at the second element to the Power Business Intelligence package within Excel 2013 which is Power Query. What it does is take badly formatted data and tidy it up. It’s often called an ETL package standing for Extract, Transform and Load. It’s similar to Sequel Server Integration Services (SSIS).
I have got an Excel workbook here and within it, I have created a Power Query. My data has got a number of problems with it. Its actually the top smartphones of the year 2017 and I’ve got to extract the configurations and models and GPUs from a couple of columns. What I can do is use all these tools at the top of the screen to create a number of successive transforms and as I apply each transform, the data gradually keeps getting tidier.
The effect maybe isn’t so substantial yet but as I move to the bottom it will begin to look a bit better now and if I click on the final transform the cumulative effect of all the different transforms will create some tidy data. What I can then do is load that into my spreadsheet. I can load it into my Excel sheet or I can load it into my underlying Power Pivot model.
I am actually going to choose my worksheet and It would be brought in the form of an Excel table for subsequent use. But the great thing about Power Query is that it will save the query, so if my underlying data changes all I need to do is rerun my query and I will get the latest data in. Power Query allows you to link not only to lots of different data sources but also to websites as well.
Power View
Strengths and the weaknesses of the package
Preparation
- Create a new Power View based on an existing file
- Take the power pivot data model which we have created earlier
- Go back to Excel and insert a Power View.
Click on the Insert tab -> Power View. And it will come up with a new blank tab and you can start to choose which columns you want to display.
- The strengths undoubtedly that it’s so quick to use. As soon as you click on a column in your underlying power view fields it will add it into what’s called a visualization and you can see that it would immediately give you a table of the total quantity of sales by region and model numbers.
- The chart, I can easily change it and it immediately updates so it’s very quick when sitting with a client to show them what their data could look like.
- If you type in a title for your Power View report and then you want to format it, you can change it to underlined, italic, change the font size, justification and so on. What you can’t do is change a color or the background or the border or anything else and that’s the same for every part of Power View so for example if you wanted to change how the chart looks you’d search in vain for all the usual excel chart formatting tools because they just don’t exist.
Power Map
- Click on the Insert tab -> Power map.
- Wait for the map to load and then create a new tour.
- The first thing you’ll do is to tell it what you are mapping. So choose an Indian postcode known as a zip and show the total quantity of sales for each map. Now that may look horribly cluttered and will be hard to use so what you are going to do is to quickly apply a filter.
- Say that actually we’ll only look at stores for this database where the number of stores is at least 100 (you can choose any arbitrary number)
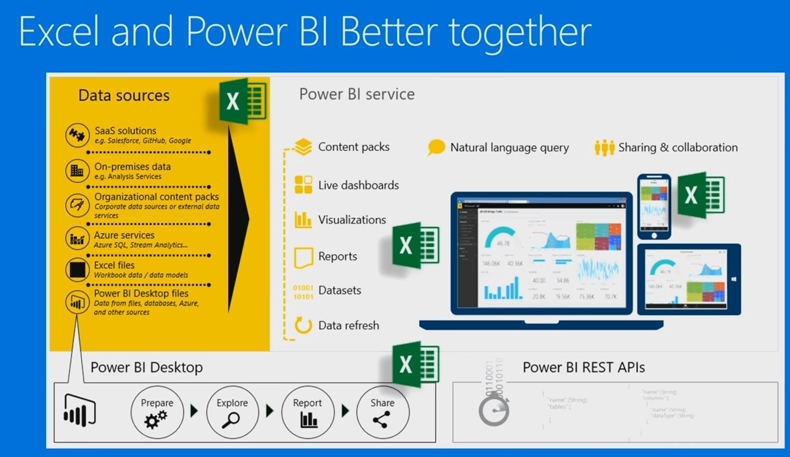
Excel as a Data Source
Excel could be a data source inside Power BI. Inside the service it could be added to content packs, while once added as an object to Power BI it could be used in live dashboards with visualizations, creating Power BI visualizations over the data in excel or using the excel visualizations you can create reports with it and edit as a data set and of course use the data refresh to get the latest data.
Once it’s up on Power BI you can use natural language query and you can share and collaborate with your data with all possible platforms whether those are the servers in the mobile, different types of devices, PC tablets and it’s also available on mobile so you are set to go.
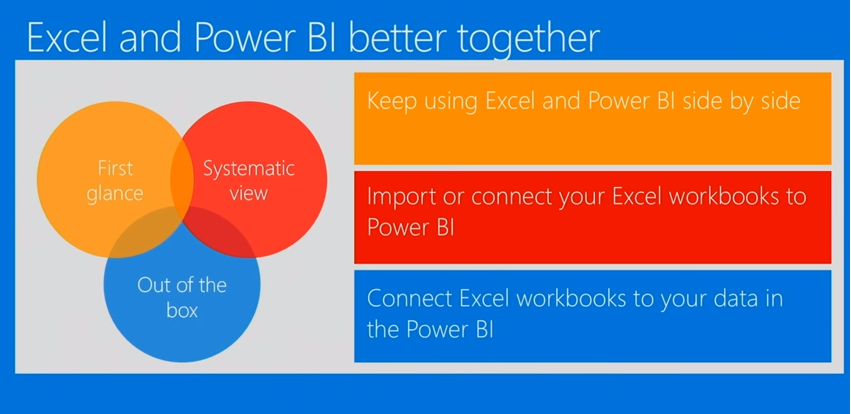
Takeaway
On the first glance you can see Excel and Power BI as two separate tools and you can continue and work with the tool of your choice and be fine with it but you do have to realize that once you learn something in one of these tools this will be very useful for you if you choose to use the other. Once you go and use a systematic scan of the capabilities of combining Excel and Power BI you can see that if you import or connect your Excel workbooks to Power BI you gain a match of each other and you can do more, you can also run the Cortana integration and everything else that Power BI has to offer.
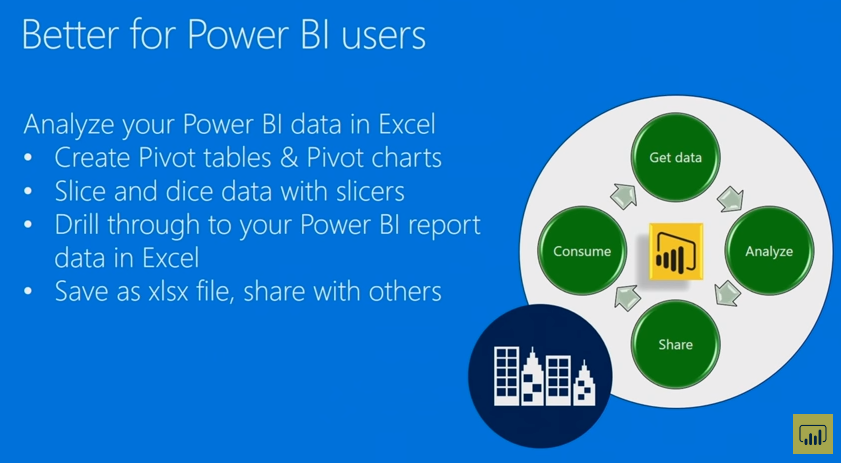
With that, you can create the visualizations of Power BI over your Excel data or you can use Excel visualizations. The creative thinking here is with the feature of analyzing Excel which provides you something I think no one else does, an ability to connect from your excel desktop, create reports in the tool that you love working with so much.
If people love looking at visualizations and they are comfortable with Power BI they can consume those from there and if you love working with seeing the numbers then you can create parallel reports to consume as a workbook. In the end, I want to say is that Excel is part of every piece of Power BI. So, enroll for Certified Data Analytics Course and feel very comfortable to use the excel tool of your choice but be sure that Microsoft Team is doing everything in their hands to make these work better together.