As the name might make you guess, a ‘time series’ in time series forecasting is a series of data points indexed as per the time order.
Alternatively, it is a series of values for a quantity obtained at successive times. These data points often are at regular intervals.
For example, the solar radiation intensity data at a specific location, measured every day at noon; or the share value of a certain company at closing time every day. The data can be about anything, as far as it is useful.
And why is data so useful, time series or otherwise? It is said that data is the next big religion in the tech world.
So much that mathematician Clive Humby once said: “Data is the new oil” and the Economic Times several years later popularized it in some of their articles.
With data, you can apply machine learning and artificial intelligence to everything. This could at its peak mean the end of human labor, and at its early stages – a much more efficient world.
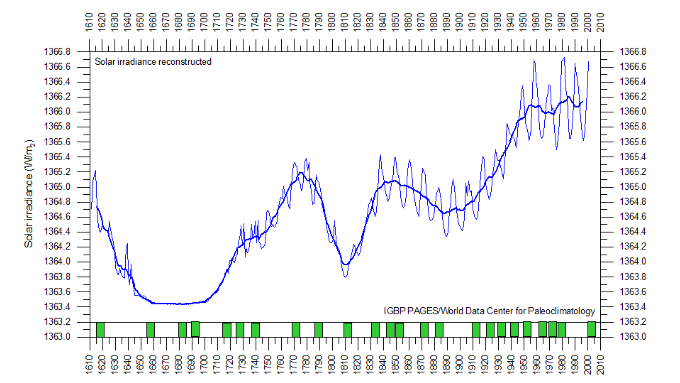
Quite frequently, time series data is plotted in the form of simple line charts. The following image gives a time series for solar radiation data based on decades.
We can imagine time series as an important type of data, one of the things that fuel the Artificial Intelligence revolution, among other things. Time series are used in mainly two ways, as follows:
Analysis and Forecasting
What is Time Series Analysis
The analysis of time series is done to extract meaningful data or insights that will help businesses/mankind in some way.
In our previous example of solar radiation intensity, this data can be analyzed with values for multiple years to quantify the speed of climate change.
A good way to describe time series analysis is that it seeks the ‘why’ behind a time series dataset. The analysis tries to understand the causes of a time series being the way it is.
Again, in our example, the data on the graph can be correlated with carbon emissions and pollution levels and we have done an analysis of why the earth is getting hotter.
What is Time Series Forecasting
Time series forecasting, on the other hand, looks at data and predicts what can happen in the future. It is also called extrapolation in the statistics world.
Going back again to our solar radiation example, time series data can be extrapolated to predict solar radiation or temperatures in the year 2050.
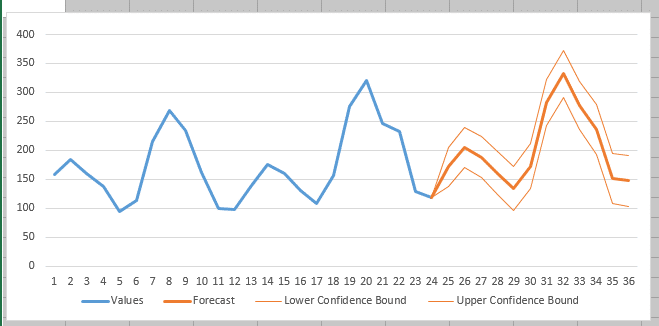
Let us take a look at the above image. It has a time series data available till 24 intervals. The orange lines beyond 24 show the prediction of values based on previous data and its understanding.
Description Vs. Prediction
When such data is available in large amounts, it cannot be processed by humans and is handed over to computers.
Computers will either analyze or forecast based on your requirement. For the same, a model needs to be constructed.
This model is either descriptive, which means it only understands and describes the data and its significance. Thus it is used in time series analysis.
The predictive model on the other hand, as the name suggests, predicts values for the future, and hence is utilized for time series forecasting.
Terminology in Time Series
Before understanding forecasting in some more detail, it is important to understand some aspects or terms of time series.
Level
It is the average value of the data, such as the average value of solar radiation over 400 years in our example.
Trend
It denotes the increase or decrease in the values, often consistently. In the radiation example, we can say the trend is upward.
Seasonality
Some patterns of values repeat itself in a cyclic manner. For example, radiation data in summers every year will be higher on a monthly graph, dipping down for winters.
Noise
This is the only non-systematic aspect of time series. It is an unnatural deviation from the usual values which cannot be explained by a model.
All the time series forecasting techniques have to give due consideration to the above aspects as they form the basis of prediction.
Diving Deeper into Time Series Forecasting
Forecasting based on time series data has been historically done since a long time, way before the onset of Artificial Intelligence.
Sports experts would study a teams performance over time and predict whether they will win a certain tournament with a certain team structure. This implies understanding ‘what is time series forecasting?’ is not difficult at all.
In modern times, time series forecasting techniques process on massive amounts of data that humans alone cannot make sense of.
Thus, there is a need for computer models. Various time series forecasting methods such as simple moving average, exponential smoothing, Holt’s winter, etc. can be used but we will focus more on the basics in this tutorial.
In statistics, the prediction is a normal part of statistical inference.
Often, an approach called predictive inference is used in statistics. This becomes the foundation for time series forecasting.
The principle of such inference is to simply pull a trend of available data from history into the future and plot predicted values.
For instance, if bread price 2 years ago was a dollar, one year ago it was $1.5, and today it is $2. We thus ‘predict’ it will be $2.5 next year.
Of course, we may be wrong, and the real world problems are far more complex than bread prices over three years. But the goal here is to get a good idea about it.
Steps in Time Series Forecasting
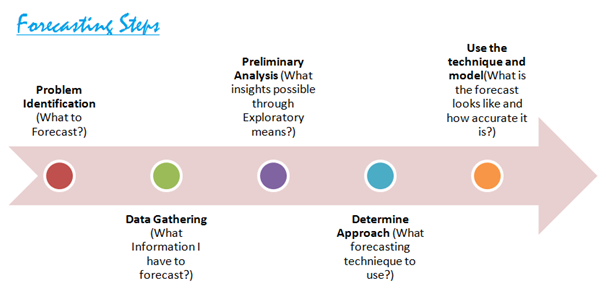
There can be different time series forecasting methods suitable for different people, but the overall process and its steps remain the same.
Defining Problem
Time series forecasting is useful if there is a clearly defined problem or motivation for predicting values.
Referring again to our solar radiation data, the problem can be ‘to predict radiation intensity in 2050 and create carbon regulating policies as per predicted values.
Thus, high radiation values in 2050 would mean stricter carbon emission laws.
Preparing Data
Preparation of data is a standard step in any data science activity. Preparation includes cleaning the data of any duplicate values or inaccurate values of impurities.
In case of time series specifically, the preparation may even include preparing time intervals, such as daily, weekly, etc.
Analyzing Time Series
Although analysis and forecasting are mentioned separate to each other, forecasting without analyzing is impossible. We can only predict future values if we understand patterns in the history of values.
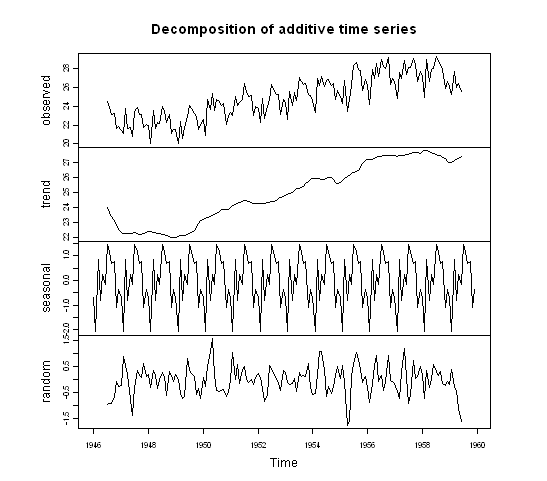
Any trends, seasonalities or noise is to be detected and noted in this step.
Creating Model
As mentioned earlier, large time series data have to be processed on computers and that needs the creation of a model.
This model depends on the software that is going to be used. Such a model, once prepared, can be reused for future data processing.
Deploying Model
Once the model is deployed, it will study the data and analytics to find values where predictions were requested.
This deployment may produce results in graphical forms such as visualizations, reports, etc.
The video that follows can help make you understand time series in detail:
https://www.youtube.com/watch?v=f9tyljdHQaA
Factors Affecting the Accuracy of Forecasting
The following factors can affect the accuracy of predicted values:
Amount of data available
The greater the amount of data available, the better the system can learn about patterns. This will lead to better accuracy of predictions.
Time horizon of required predictions
Time horizons of predictions can be short, medium or long. Shorter horizons always provide more accurate forecasts.
Frequency of updating forecasts
How frequently the forecasts are updated can also affect accuracy. Updating forecasts as soon as new information becomes available and usually results in higher accuracy.
Statistical Software and Programming Languages for Forecasting

The sizes of data make it impossible for humans as well as regular domestic computing applications to process and forecast with considerable accuracy.
For this reason, specific software and programming languages for the same may be required to create and deploy models for different time series forecasting methods.
Creating programs for Time Series Analysis or Forecasting can be done by using Matlab or R, which are widely used.
R is the best choice for standard time series models, it also comes with prepackaged functions. Matlab is considered by many as cleaner and simpler.
Alternatively, Python is also gaining popularity in this application. Unlike the previous two, Python is a general-purpose programming language.
Python is also widely used for machine learning and data science other than time series, as it has excellent library support.
There is no restriction on the type of software that can be used. Besides, the selection may also depend on factors specific to your data or your problem statement.
You have to keep in mind what is time series forecasting and why you really want to use it, to find the perfect software.
Practical Applications of Time Series Forecasting
As far as the world of data science is concerned, time series data holds special importance.
This is because a lot of important data shows itself in a time-based format and is important to be analyzed that way.
Following is a list of real-world applications achieved via several-time series forecasting techniques.
(i) Weather forecasting
(ii) Earthquake prediction
(iii) EEG (monitoring electrical activity of the brain)
(iv) Mathematical finance
(v) Sales forecasting
(vi) Population forecasting (human as well as animal)
(vii) Forecasting climate change
(viii) Forecasting stock prices each day
These are only a small portion of a large number of practical applications where time series data and its analysis/forecasting is important.
Summary
Having no doubt about the importance of data science and artificial intelligence, it becomes essential to give time series data its due importance.
It can be thus concluded that time series forecasting can play a significant role in processing data and making future predictions about numerous things. These can range from finance to politics and weather to healthcare.
It will, however, require systematic problem defining, data preparation, model creation and deployment using the most suitable software application.
Are you also inspired by the wonderful techniques of Data Science? Enrol in our Data Science Course to elevate your career.