Creating a new website is easy, but when it comes to monitoring and promotion, then it is probably the toughest job to do.
Actually, monitoring and promotion are interlinked; if you want to promote your website in the best way then you will have to monitor it in the best way. In this article, we will provide you with a Google Analytics Tutorial that will help you monitor your website in the best possible way.
Before you start working on the promotion of your website, you need to know a lot of things like are you getting enough visitors on your website, which region and community do your visitors belong to, do they stay longer on your website or just bounce back, and so on.
Once you know the answer to these questions, you can work on your website’s promotion in the best manner and soon you will be seeing a positive change in your website’s search engine ranking.
According to reports, at least 27,725,874 live websites are using Google Analytics to track and optimize their performances.
That is why, in this Google Analytics tutorial, we will tell you what the Google Analytics tool is and how it can help you monitor your website and promote it.
Google Analytics Tutorial for Beginners
What is Google Analytics?
Google Analytics is nothing but a Google tool that will help you monitor your website, track user activity, and provide you with all the relevant data necessary for your website’s promotion.
These activities include the number of users who visited your website, how long they stayed on your website for, and so on.
Google Analytics tool has been very well designed and it can even let you know your page load time. Google Analytics, in simple words, is a tool that will fetch you the real data of your website.
This data can be further utilized by you to promote your website. You can use it to improve your SEO plan, as well as business intelligence.
Let us have a look at the Google Analytics Tutorial Video to understand the concept with their practical implementation.
Google Analytics Tutorial Video
This Google Analytics Tutorial Video will take you into the world of Google Analytics and clear all its associated concepts.
Now, let us take this Google Analytics tutorial for beginners to the next step and understand why would anyone need Google Analytics?
Why Do You Need Google Analytics?
Google Analytics is the best tool available on the internet to track your website’s user activity.
This tool is available for free on Google and will provide you with the information on your website’s visitors.
This tool will help you analyze the performance of your website in the best possible manner. You can get answers to a number of questions that are essential to check your website’s performance.
How Google Analytics Can Help SEO Analysis
Google Analytics gives you access to a large data set where you have access to visitor information and interact with your site.
You can see the number of visitors that come to your site, where these users come from, and how they interact with your site.
All this data can help you build better SEO strategies, and it will help understand the most effective keywords, which content needs to be improved, and which is the most engaging content or campaigns.
And, this data will be made available in real-time, which means you can analyse visitor data and make improvements to your content.
Google Analytics Metrics & Definitions
Once you see the Google Analytics report, you will be able to understand what is working on your website and what’s not. You can further work upon these measures and enhance your website.
Optimizing your website becomes really easy and efficient when you have the reporting power of Google Analytics. It provides you with information through which you can clearly understand which changes are required on your website to improve its performance.
Considering this fact, using Google Analytics becomes extremely important if you want your website to work like a charm.
For online marketers, this tool is a boon considering the information that it provides. Using Google Analytics is really easy due to its simplified user interface and easy controls but if you are new to it you might face certain difficulties.
If you are a newbie, don’t worry. In this Google Analytics tutorial for beginners, we will guide you on how you can set up Google Analytics and start your journey on this platform.
Setting up Google Analytics – Tutorial on Google Analytics

Setting up Google Analytics is really easy. You just need to have a Google account. After you have created an account, follow the steps mentioned below:
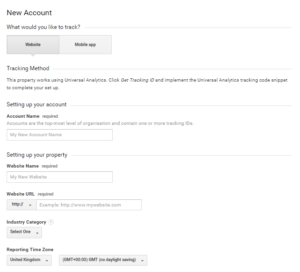
(i) Go to http://www.google.com/analytics/ and click on New Account. You will have to set up everything for your website from scratch.
(ii) In the next step, Google Analytics will ask you to choose an option between Website or App. Here, you choose the one which you want to track. Since this is a Google Analytics tutorial for website tracking, you will have to select the Website option.
(i) Now, fill in the necessary details asked by Google Analytics, like your website name, URL, your industry, time zone, and so on.
(ii) Now, in the next step, Google Analytics will ask you if you want to share your information with Google or not. It totally depends on you how you want to proceed. Once you are done with that, click ‘Get Tracking ID’.
(iii) Now, you will get your unique tracking ID. Copy the entire tracking code and paste it into the page’s code that you want to track. We recommend that you paste this code in the header section (<head> section) of your page.
Add Tracking Code in the WordPress Site:
You can either do it manually or let Google Analytics WordPress plugin do that.
We first take you through the manual method:
Method 1
1. Login to your WordPress website and go to the dashboard. Hover over the appearance tab and click on the Editor button.
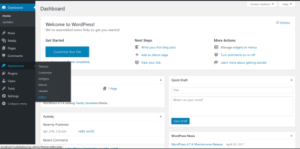
2. This is actually Edit Themes Page on your screen right now. Look in the right section of the page (templates section) and search for “header.php”. You can also press CTRL+F to speed up this search process. Once you find “header.php”, click on it.
3. Now, you can edit this file. Here, look carefully for the <head> section or you can also use CTRL+F to find it easily and quickly.
4. Once you have found the section, click on it and press Enter to take it to the next line and paste the Google Analytics tracking code above it.
5. After pasting the tracking code in this file click on the “Update File” button.
6. If you want to check whether you have done things right, go back to the Google Analytics tab and wait for a few minutes to check if Google Analytics is receiving any data from your page or not.
Method 2
You can also add the Google Analytics tracking code by Google Analytics WordPress plugin which you can find by the name – Google Analytics for WordPress by MonsterInsights Plugin.
1. Search for this plugin in your WordPress dashboard and download it.
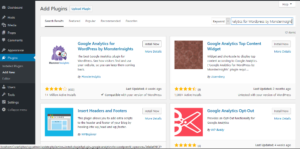
2. Once you have downloaded your plugin, activate it. Now, you have to configure this plugin.
3. In the setting section of the plugin, click on “Click here to authenticate manually” to enter the Google Analytics tracking code.

4. Copy your Google Analytics tracking code as mentioned in the above steps.
5. Now paste your tracking code in your plugin and click on “Save changes”.
Once you have pasted your tracking code, wait for a few minutes on your Google Analytics page to start receiving data.
Now, you are all set to start using Google Analytics for your website. You can track your pages as you wish.
What does the data mean?
When using it for the first time, you might find Google Analytics really tricky and confusing as well, but don’t worry, we will help you understand each and every terminology related to it.
When you have created a new website and want to track user activity on your website, just paste the Google Analytics tracking code on your website’s code and you will get the required information. However, the data being displayed to you might confuse you.
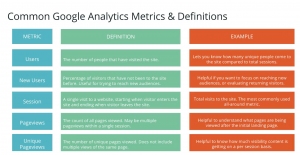
Below, we have mentioned the kind of information that you can expect from Google Analytics and the meaning of those terms.
Google Analytics Information and Metrics
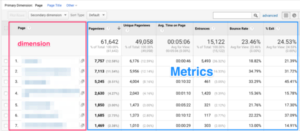
1. Visits
This tells you how many times the user has visited your website.
2. Unique Visitors
As the name suggests, this tells you how many unique visitors have visited your website in a specific time frame. This is different from total visits.
If a user from a specific IP address will revisit your website in that time frame then Google Analytics will increase the total visits, not the unique visits.
3. Page Views
It lets you know the number of pages a user has looked at during the duration of their stay.
4. Pages/Visits
This is a ratio of page views divided by visits.
5. Average Visit Duration
This tells you the average duration for which visitors stay on your website.
6. Bounce Rate
This is a very crucial piece of information displayed by Google Analytics. It tells you the percentage of users who visit your website but ‘bounce back’ in a time frame.
Now, a user might bounce back for plenty of reasons and this time frame is still unknown. It could be anywhere from 5 minutes to 10 minutes.
7. Percentage of New Visits
This tells you the percentage of users who have visited your website for the first time in that time frame v/s the number of people who visited your website before that period.
It’s not over yet, a tutorial on Google Analytics provides you with other similar information like data manipulation and so on. Don’t worry, with the passage of time, you will get used to these terminologies and understand them better than ever.
We suggest you set up your Google Analytics today, don’t delay.
Now, let us take this tutorial on Google Analytics a bit further and understand how you can set your goals on Google Analytics?
How to Set Your Goals on Google Analytics
You can actually tell Google Analytics what is important for you. Google Analytics will then display the data according to your priority.
Now, let us suppose that you have an e-commerce site and a confirmation page after the purchase page. What if you want to keep that in priority? You can let Google Analytics know that.
Google Analytics will track this information and let you know if your conversions are up to the expectations or not.
Determining your tracking goals will help you analyze much more than just site data. Setting up goals will also give Google an idea of what is most essential to your business.
You can actually set up to 20 goals at once on Google Analytics, and it is recommended that you set up at least two goals.
When setting up goals, you need to understand that Google will track important information and conversions to understand the effectiveness of your website.
Let’s look at this with the help of an example: Say you have an e-commerce website, then you need a confirmation page when a customer completes their purchase. With this, Google Analytics will be able to track the number of purchases and you will get a clear picture of how well your efforts were received.
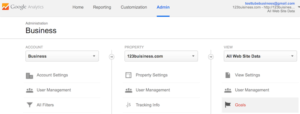
Step 1:
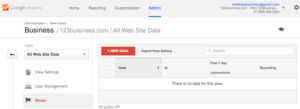
First of all, login to your Google Analytics account and click on the admin tab and go to the VIEW section and click on Goals.
Admin -> Create View -> Create New -> Goals
Step 2:
There, you will see a red option with the name ‘+New Goal’, click on it.
Step 3:
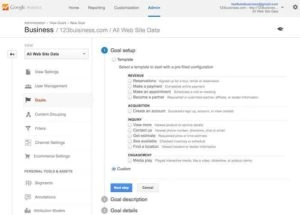
In the next step, you will be provided with three options where you can choose among using templates, creating custom goals, and creating smart goals for setting up your goal.
In the first option, you will get four categories: Revenue, Acquisition, Inquiry, and Engagement. Choose accordingly.
If you want to go for Google AdWords, then you can choose Smart goals.
After that, you will have three choices to finish creating your goals:
Template
Under template, you will get revenue, acquisition, inquiry, and engagement, and you can create a goal template for each category to understand how your customers are interacting with your website on every step of the way.
Custom Goal
Here, you can create a custom goal based on your specific objectives, and not create a template as stated above.
Smart Goal
With a smart goal, you can use AdWords to optimize the tracking of your conversions. In this option, you will get a score for your website from Google Analytics, which can help you determine which visits are most likely to become a lead.
Step 4:
Once you configure the goal categories, you need to name and categorize your goals next. You can provide a description of your goal like destination, duration, and so on. Ensure that you name your goals in a unique way so that it is easier to reference them later. You can choose the destination to target users of a specific destination. Choose the duration and other steps accordingly. You can’t delete your goals later, but you can modify them. Goals can be described in four ways:
Destination
If you treat your page views as subscriptions, then choose the destination as your goal type. This category will help you measure your subscriptions.
Duration
Pick this option if you measure your subscriptions according to the time customers spend on your website.
Pages/Screens per Session
Here, you treat your number of page views as subscriptions. The ‘Screens’ here refers to the number of mobile screens when measuring the performance of a mobile app.
Events
You can choose this type if you consider the level of interaction between your audience and website as a subscription.
Step 5:
Now, in the next step, you will be asked for more goal details. Say, you choose the destination in your goal type, then enter the URL of the page in the specific field. You can even assign a monetary value to your goals, but this option is only available if you have not selected Smart goals earlier.
It is a good practice to set up a funnel to understand the path your customers take when they interact with your website.
Now, you are all set. You have to create a new goal and your Google Analytics data will be updated accordingly.
The next step in this Google Analytics tutorial is understanding the infrastructure of the Google Analytics platform.
Google Analytics Infrastructure
Google Analytics records website data and presents it in the form of tables, charts, and graphs.
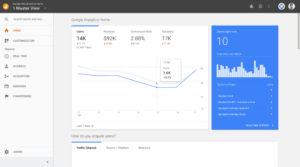
The above image shows what the Google Analytics home page looks like. Let us discuss each element on the homepage in detail.
Reports
The ‘Reports’ option on the left panel gives users access to various reports in certain areas. They provide information on the following.
Real-Time Reports:
Users can ascertain how users interact with your website in real-time, including the user’s location, the content they are interested in, and so on.
Audience:
Here, you will be able to analyse the behaviour of your audience, such as how they engage with your content and what device they use to access your website.
Acquisition: In this section, you will be able to understand where your traffic is coming from and what is the source of the traffic.
Behaviour:
You can also learn and analyze how users behave and interact with your website by looking at the bounce rate, page views, number of visits, etc.
Conversion:
In the conversion option, you can check the actions taken by your visitors and how your website helps people do these actions.
Search:
Using the search option, you can quickly look for a report that you want to review or access help documents.
Customize:
You can also customize your dashboard based on your requirements and how you would like to use Google Analytics.
Admin:
This option lets you access your Google Analytics account to manage your account or change the settings.
Scrolling down on the homepage will show you another set of reports:
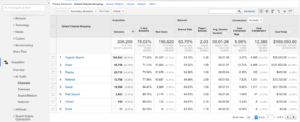
Traffic Reports
These reports tell you where most of your traffic is coming from, which can be used to form your marketing strategy.
To understand where your traffic is coming from, go to Acquisition -> Overview to get an idea of how well your marketing strategies are working.
For instance, if your traffic is the most from referrals, you will know that your guest posts are effective.
Audience Reports
Using these reports, you can localize your data and content based on the location of your target audience. It also helps you plan new content according to what your audience prefers to read.
Go to Acquisition -> All Traffic -> Channels to know the sources your audience is engaging with your site.
Behaviour Report
With these reports, you can analyse the performing and non-performing content.
Go to Behaviour -> Site content -> All Pages to look at individual page performance on your site. With this data, you can publish the kind of content that attracts your audience.
Here are some questions you need to ask yourself when working with Google Analytics.
Who is your Audience?
Like we discussed above, the audience report allows you to know who is your audience, what their interests are, and how they interact with your website.
What attracts your new and returning visitors?
Returning visitors are your loyal followers or customers who have found something of interest in your content. New visitors are your first-time visitors who found you through referrals, ads, or a campaign, and are interested in exploring your content.
If your new visitors are fewer, you need to look at the reason behind this lull. Maybe think of a new SEO strategy or increase referrals and ads.
Next comes analyzing your returning visitors. Are all your visitors coming back to your site or has this number reduced? If the number of returning visitors is low, you can use Google Analytics to determine what your users don’t like about your content that is turning them away.
Which are the top devices used by your audience?
When you know the technology your audience is using to access your content, you can better use your marketing strategy to those devices. Say, your mobile usage is lower compared to other technology, you can focus on improving your traffic in that area.
Setting Up Your Google Analytics Dashboard
The next part of this Google Analytics tutorial focuses on customizing your dashboard to suit your website’s needs.
But, before we get started with the steps for customizing your dashboard, check out this short tutorial on how to customize your Google Analytics dashboard.
Property Settings
First, enable special reports that will allow you to view all the things we discussed above – your audience, their interests, locations, and more. To0 enable special reports, go to Admin option in the left panel and select Property Settings. In here, ensure that the following options are checked:
(i) Is the URL correct?
(ii) Enable Demographics and Interest Reports
(iii) Use Enhanced Link attribution
(iv) Enable Users Metrics in Reporting
(v) Is Google Ads linked and is PPC data populating?
(vi) Is Google Search Console linked correctly?
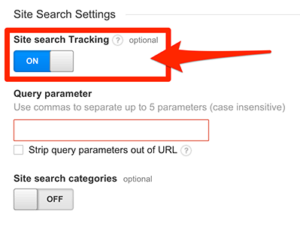
View Settings
Next, check if the viewing settings are enabled like:
(i) Ecommerce tracking
(ii) Site Search Tracking
(iii) Verify URL
(iv) Verify time zone and currency
To enable these settings, go to Admin, then View Settings.
When you select the Bot filtering option at the bottom, you can filter out most referral spam.
You can even set a filter for your IP address in Google. To do so, follow the below steps:
(i) Log in to Google Analytics.
(ii) Go to Admin -> View Setting -> Filters -> Add Filter
(iii) Then, name your filter.
(iv) Then choose to exclude.
(v) Now, select choose traffic from the IP address and add your IP address.
(vi) Lastly, select the equal to option.
Alerts
Next, set up alerts to know when the parameters you have set are accomplished. This is essential for those you work with Google Analytics daily.
You can set an alert by going to Admin -> Custom Alert -> New Alert.
For example, you can set an alert when your organic traffic decreases or increases by 25% in a day.
Dashboard
Setting up the dashboard is as important as setting up alerts since it can easily help you navigate Google Analytics. You can customize your dashboard to get a high-level view of data and sort by what you would like to see regularly. A dashboard can have only the basic data or in-depth statistics of all your reports.
Configure Site Search
Setting up this option will help you understand what your visitors look for when they visit your site.
Let’s conclude this Google Analytics tutorial with some tips for using the same to get the most out of the platform.
Track visitor activities
You need an in-depth analysis of what your visitors are doing when they visit your site. Measuring site activity with pageviews and the total number of visitors will not give you the data required to understand if your audience likes your content.
You need to measure how long your audience stays on a particular page and or if they come back. Sometimes, your audience may just grab the piece of information they are looking for, and thus, having that kind of content will help entice them.
This data is available in the same table as your other stats. Carefully study these numbers to understand what they really mean.
Know your audience’s location
Your website may appear in search ranking across the world since Google serves various countries in their regional language. So, it’s best to keep a tab on the type of content that attracts global users and focus more on publishing that content.
The location of your audience can be found under the Demographics tab. The dark green represents more views from a certain location.
Keep an eye out for popular keywords
While searching for keywords is the first part of your SEO strategy, Google Analytics can help you track the keywords that brought visitors to your site. Thus, you can track all of your user’s activities. You can find the most popular keyword searches responsible for bringing visitors to your site in the Traffic Sources tab.
Once you analyze the visitor data, your next question should be: What can you do about it? The easiest way to target the right audience is by providing niche content that is not available through the use of laser-targeted keywords.
Backlinks via referrals
To determine how many of your referrals got visitors to your website, go to your referral stats. Once you find the most lucrative backlinks, continue building traffic through these links. Both short-term and long-term referral data can be found in the Referrals option, giving you a chance to compare the most effective backlinks.
Say, a certain ghost article had a lot of subscribers a year ago, but now their followers have reduced, and hence, the referrals from this source are lower than what they were a year ago. This means it might be beneficial to move away from this source and collaborate with another site.
Social media flow
In the digital era, social media is the best way to interact with your customers. With Google Analytics, you can get an estimate of how many visitors are finding your site via social media or social sharing websites.
You can find the social media flows under Network Traffic option. Also, this data constitutes a flowchart page wherein you can see websites which had the most referrals and visitor flow on your landing page. Compare these social insights over weeks and months to analyze, which is a steady referral source.
Website Latency
Internet speeds are faster nowadays, and thus you need to increase your website latency. Web pages that are slow to load might irritate your users, and hence they might end up leaving your site without looking at your content.
To get an idea of your website’s speed, go to the Overview section in site speed. You can find page-specific information there, such as the average load time of each page in seconds, etc.
A page with too many videos or graphics elements might take longer to load than a page with static text. So, ensure that your page doesn’t have more visuals than are required.
Locate Bounce Pages
While the pages that attract the most visitors should be monitored constantly, you need to keep an eye out for pages that are driving away your traffic. As discussed above, you can track your bounce rates with Google Analytics.
The platform also allows you to study user actions and also the unique actions performed by visitors that are having a negative impact on your success rate. But, you also need to realize that bounce rates are common when your content has off-beat topics.
Instead of scrambling to fix bounce rates, focus on generating content that engages visitors and directs visitor attention to such pages.
Goal conversion
Many websites prefer to set a pre-defined course of action for their visitors to follow. The statistics provided by Google Analytics will help you determine this path.
Say, you are an e-commerce website and want to map out a path that takes visitors from the cart page to the payments page, and after the payment is done, to the ‘thank you for your order’ page.
Even if your goal is not to sell anything, but to register for a forum or web app, setting up goal conversions can help you do that. You can follow the goal conversion data under the Conversions option.
Visitor metrics
If you have the kind of content that fits your keyword perfectly, users searching for that keyword will have a higher chance of visiting your site. And, once you land the visitors, your site needs to interact with your audience to keep them engaged.
Google Analytics will give you unique and returning visitor data. This will aid in your comparison efforts. Maybe the number of visitors was low during a particular period and picked up again as the count of visits increased.
Landing page reports
You can improve your conversion rate with the help of landing page reports. These reports show you the pages that greet visitors; i.e., which pages are getting the most visits.
Say your ‘blogs’ page is most often the landing page, then use that to your advantage by adding more backlinks to your blog articles. Having a landing page report for all your website pages is immensely helpful to analyze site data and increase conversion opportunities. There are also advanced segments that you can use to filter the total traffic and find out the number of people coming in from social media or referrals.
In-page content analysis
With Google Analytics, you can track every click your visitors made on every page of your website. While this might look like too much data, it is helpful for an in-depth analysis.
You can find solid tracking numbers above the page preview, which is extended to your overall ratings. It’s available in the form of a visual graph under the In-Page Analytics option.
Here, you can even add image coding to your dashboard, helping you study the traffic flow better.
Custom searches
With Google Analytics, you can implement custom traffic data for your custom website search. You need to set up this functionality, and you will be surprised by the number of visitors using the search on your website.
This feature will help you track the popular keywords on your site and whether visitors find these searches helpful or not. Redesigning and or revamping the search results page using A/B split testing can help customize such analysis.
You can learn all about setting up custom site searches under the Overview section.
Real-time analysis
Google Analytics has a real-time tracking page where you can look at the current visitor activity on your site. The information will be available in the form of graphs and flowcharts. You will also be able to see the source via which they landed on your site.
At the bottom of the page, you will find visitor location, giving you an idea of how your website performs in real-time on a daily basis.
Intelligence events setup
You might not be able to track your site’s daily performance, and chances are, you might miss out on a deviation from one aspect to the next, and such fluctuations will surprise you when you analyze your reports.
Setting up even indication for intelligence events can help you keep track of important parameters. This feature allows you to receive notifications for important deviations from patterns. Say your site suddenly sees an increase of 200% in traffic on the same day. This would be categorized as unusual, and you will be notified of the change.
Closing Thoughts
All the data found on Google Analytics can help you in some way or the other, but you need to know how to leverage it. If you are a beginner in Google Analytics, taking a short online course will help you understand how to use the same on your marketing analysis and decision-making. You will also get an idea of the industry best practices for using the platform.
Understanding how Google Analytics works is essential for any marketer or SEO professional. This Google Analytics tutorial is aimed to help you better understand the vital concepts of using Google Analytics platform.
Joining Web Analytics Training will enable you to learn and master Google Analytics to set up your Google Analytics today and track the user activity of your website like a pro.