
Sociologist Mark Granovetter said in his 1973 article, “The Strength of Weak Ties”, it’s not enough to notice that two people are connected to each other. Get your eyes glued to the guide of Network Analysis in Python.
Other factors like their structural relation to further people and whether those people are also connected to one another really matters.
Quantitative network analysis in Python offers a way for researchers to move between the graph and the particularities of people and what ties them to each other.
In this article, you’ll learn about what network analysis in Python is all about, what you can learn from network data, the use of Python in networking, and the basics of NetworkX.
What is Network Analysis in Python?
The use of Python in networking is one of the most important concepts in data science and analytics. To understand Network Analysis in Python, we first need to understand what a social network is. A social network isn’t just Facebook or Instagram. Let’s take an example. The image below connects different actors on the basis of how many times they’ve worked together.
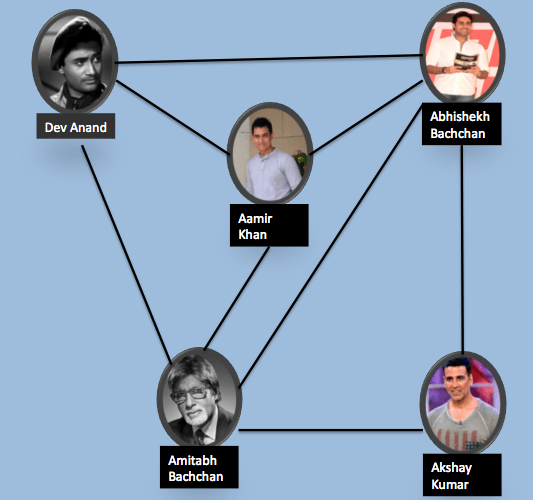
Looking at the image above you can see that Abhishek Bachchan has acted once each with all the actors in the image whereas Dev Anand has acted with just 3 and Akshay Kumar with just the two Bachchans.
This too is a kind of social network. Basically, any network that has connections which outline the relationship between the different individuals is a social network. Analyzing these networks is what Network Analysis in Python is all about. Each network has:
Nodes
This refers to the individuals in the network; the network itself is built on the relationship between the nodes. In this example, actors are the nodes.
Edges
Edges refer to the connection between different nodes. The edges represent the relationship between the nodes which is effectively what the network is built on. In the example, the fact that the actors have worked together is the connection.
What can you learn from Network Data?
Network analysis can yield a lot of useful insights in terms of who is the most influential person in the network, which individual is well connected, and so on. Obviously, any network analysis is in terms of the relationship that defines the network.
Let’s explain this with the help of an example. Every year the Nobel winners are announced in October. Say you are fascinated by one of the prize-winning topics and you want to be able to understand it better. With so much out there, from scientific journals to news clips, it can be difficult to get the right information.
Who are the key players, how do I reach out to them, what are the latest topics? These are the questions that keep haunting you. Ordinarily, it can take years to master a field, by reading different publications, going to conferences, finding the right experts and leveraging their connections.
However, with a knowledge of networking in Python, it’s easy to get insight into this network simply by analyzing relevant journal publications. Network analysis can help you gain expertise as an outsider in a way that would ordinarily take you several months.
NetworkX Tutorial
There are a number of different networks that can all be analyzed using NetworkX. To begin, you will have to install the latest version of NetworkX using the method below:
pip install networkx
If you’re working in Anaconda, use:
conda install -c anaconda networkx
Creating the Network
Let’s begin by looking at the different types of networks and how to create them:
Symmetric Networks
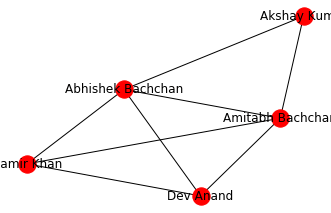
The network of actors we used in the example above is symmetric network. The relationship in the symmetric network is simple; if A is related to B, then B is related to A.
In the above example, if Akshay Kumar has worked with Amitabh Bachchan, then Amitabh Bachchan has also worked with Akshay Kumar. To create this network in NetworkX we use the Graph() method to create a new network. To add an edge between two nodes, we use add_edge(). Here’s what it looks like:
import networkx as nx
G_symmetric = nx.Graph()
G_symmetric.add_edge(‘Amitabh Bachchan’,‘Abhishek Bachchan’)
G_symmetric.add_edge(‘Amitabh Bachchan’,‘Aamir Khan’)
G_symmetric.add_edge(‘Amitabh Bachchan’,‘Akshay Kumar’)
G_symmetric.add_edge(‘Amitabh Bachchan’,‘Dev Anand’)
G_symmetric.add_edge(‘Abhishek Bachchan’,‘Aamir Khan’)
G_symmetric.add_edge(‘Abhishek Bachchan’,‘Akshay Kumar’)
G_symmetric.add_edge(‘Abhishek Bachchan’,‘Dev Anand’)
G_symmetric.add_edge(‘Dev Anand’,‘Aamir Khan’)
We then use nx.draw_networkx(G_symmetric) to visualize the network. Here’s what it looks like:
Asymmetric Networks
An asymmetric network is one where the relationship between the nodes is not “if A is related to B, then B is related to A”. Let’s take the case of an “is the child of” relationship.
If A is the child of B, then B is not the child of A. This is an example of an asymmetric network. The DiGraph or Directional Graph method is used to build an asymmetric network in NetworkX. Here’s how it’s done:
G_asymmetric = nx.DiGraph()
G_asymmetric.add_edge(‘A’,‘B’)
G_asymmetric.add_edge(‘A’,‘D’)
G_asymmetric.add_edge(‘C’,‘A’)
G_asymmetric.add_edge(‘D’,‘E’)
We can use the same draw_networkx() function to visualize this. There’s a chance that the nodes may not separate out and be distinctly visible. We can use the spring_layout() function followed by the draw_networkx() function. This will force a node positioning that allows us to distinctly see each node.
nx.spring_layout(G_asymmetric)
nx.draw_networkx(G_asymmetric)
In the images below, the first one is without the spring_layout() function while the second one includes it. You can see a distinct difference between the two.

Weighted Networks
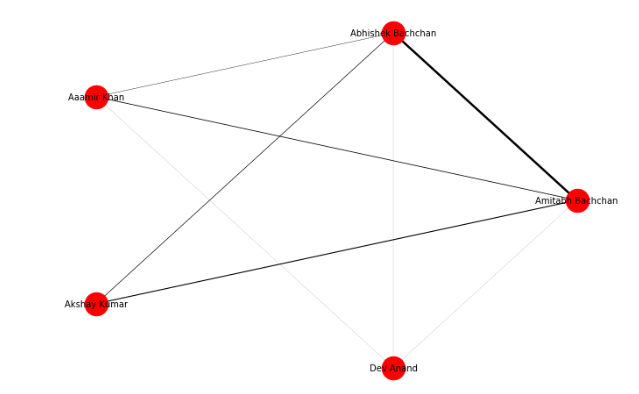
In the examples above, we did not assign any weights to the networks. However, in the example with the actors, if we attach a weight to the number of movies that they have done together, the result is a weighted network.
If we recreate the network as a weighted network, we simply need to assign a weight to each edge; the weight representing the number of movies the two actors have done with each other. Here’s how it can be represented using NetworkX.
G_weighted = nx.Graph()
G_weighted.add_edge(‘Amitabh Bachchan’,‘Abhishek Bachchan’, weight=25)
G_weighted.add_edge(‘Amitabh Bachchan’,‘Aaamir Khan’, weight=8)
G_weighted.add_edge(‘Amitabh Bachchan’,‘Akshay Kumar’, weight=11)
G_weighted.add_edge(‘Amitabh Bachchan’,‘Dev Anand’, weight=1)
G_weighted.add_edge(‘Abhishek Bachchan’,‘Aaamir Khan’, weight=4)
G_weighted.add_edge(‘Abhishek Bachchan’,‘Akshay Kumar’,weight=7)
G_weighted.add_edge(‘Abhishek Bachchan’,‘Dev Anand’, weight=1)
G_weighted.add_edge(‘Dev Anand’,‘Aaamir Khan’,weight=1)
This is the visualization. The thickness of the edge indicates the weight of the relationship. For instance, you can see the relationship between Abhishek Bachchan and Amitabh Bachchan carries the maximum weight followed by that between Amitabh Bachchan and Akshay Kumar followed by Aamir Khan and Amitabh Bachchan.
Multigraph
A multigraph refers to a graph where there is more than one attribute given to the edges. In this case, two nodes within a network can be connected with two different edges or relationship.
For instance, in addition to the existing relation, we can define an additional relation of “neighbor between two nodes A and B. The MultiGraph class is used to create a multigraph using NetworkX. Here’s what it looks like.
G = nx.MultiGraph()
G.add_edge(‘A’,‘B’,relation =‘neighbor’)
G.add_edge(‘A’,‘B’,relation=‘friend)
G.add_edge(‘B‘,’C‘, relation=’neighbor’)
G.add_edge(‘D‘,’C‘,relation=’friend‘)
In order to check the connections we can use G.edges(). This is what the output would look like:
MultiEdgeDataView([(‘A’, ‘B’, {‘relation’: ‘neighbor’}), (‘A’, ‘B’, {‘relation’: ‘friend’}), (‘B’, ‘C’, {‘relation’: ‘neighbor’}), (‘B’, ‘D’, {‘relation’: ‘neighbor’}), (‘C’, ‘D’, {‘relation’: ‘friend’})])
Connectivity of the Network
Here are a couple of important concepts that help us find out more about a particular node within the network:
Degree
The degree refers to the number of connections a node has. This can be determined using the degree function in NetworkX.
nx.degree(G_symmetric, ‘Dev Anand`)
Since Dev Anand has worked with only 3 actors in the network, the answer will be 3.
Clustering Coefficient
There is a tendency for people who share connections in a network to form clusters or associations. To determine the clusters of a node, we use something called Local Clustering Coefficient.
This refers to the fraction of pairs of the node’s friends that are connected to each other. The nx.clustering(Graph, Node) in NetworkX helps us find the Local Clustering Coefficient.
This was just an introduction to Network Analysis and the use of Python in networking. You can refer to this video to understand more about Network Analysis.
Network Analysis? Now over to you!
NetworkX is a great tool to master networking in Python. If you want to have a more thorough knowledge of Python and networking in Python, then a comprehensive data science course is probably a good idea. If you don’t want to do a course, the best place to learn more about NetworkX is the official documentation. In either case, network analysis is a great tool that most budding data scientists should have in their arsenal.


Your article is really interesting, I am thinking to read your other articles too.