Introduction to DAX Functions
DAX stands for Data Analysis eXpressions. It is basically a language that is used to calculate or analyse existing data (similar to Microsoft Excel functions). Sure, you can analyse data as-is by using charts and other such tools, but sometimes it is necessary to carry out calculations to understand better. For example, if you have some sales data, you can easily create a month wise report for a given year. But calculating the percentage difference between each month is one simple area where DAX can be effectively used (Psttt… this particular calculation is easily done using pivot tables, in Excel). However, DAX is not limited to such simple uses, it has powerful capabilities. Read this DAX functions tutorial to get an understanding of it.
To use DAX is simple enough if you are already familiar with a few excel functions. For the purpose of this article, we will be using DAX in Power BI Desktop, a free application by Microsoft for data analysis, modeling and visualizations.
We will use a simple sales data model to demonstrate. Best way to learn would be to follow along with this tutorial (download practice Power BI file here. Excel file here). This data model is made up of 3 tables – one is for customer details, the second is for invoices and the third one is for each list item for each invoice. Each is linked to the other by having common columns. Here is a simple diagram showing the relationships.
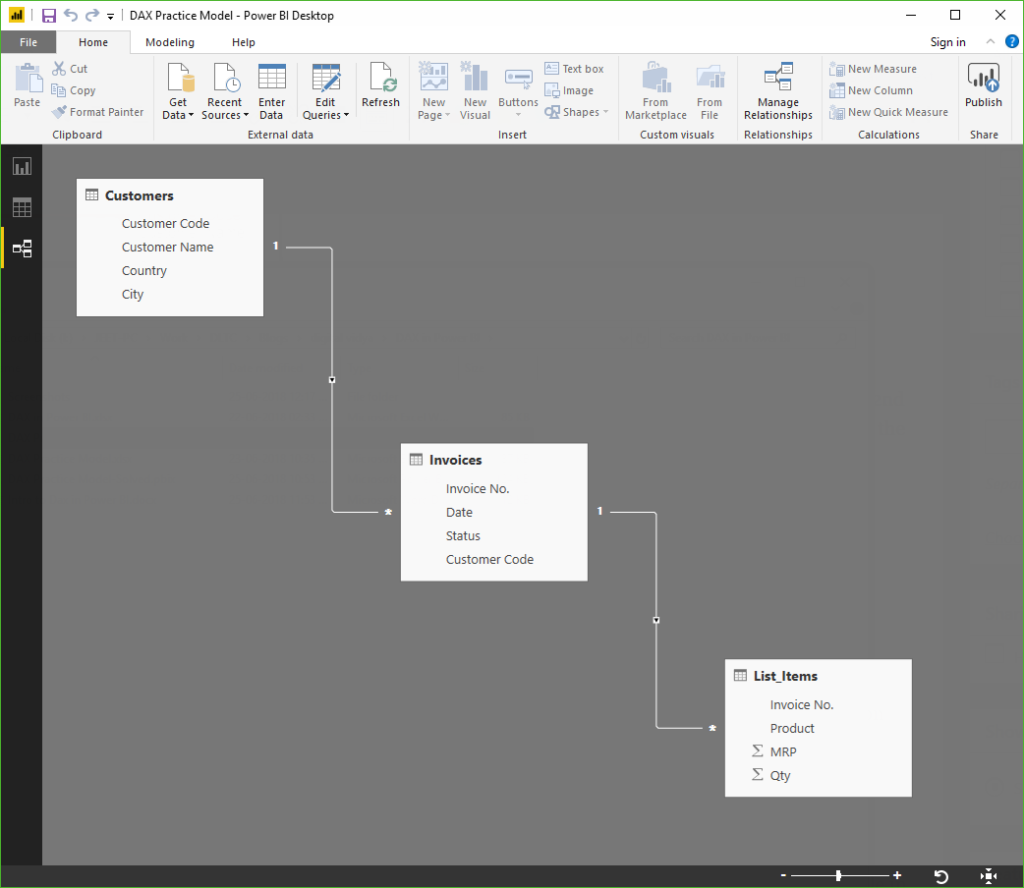
Power BI basically has 3 screens – Reports, Data and Relationships.
You can see/build the relations in the Relationships view in Power BI (3rd Button on far left of screen). But first, go to the Data View (2nd button) to understand the dataset, to see the tables (on far right of screen) and their columns, so you understand what is available; it is the first step for any good analysis.
Coming back to DAX, these functions will be put in in the Data view. There are 3 things in Power BI where you can use DAX –
- Calculated Columns
- Measures
- Tables
We will go through all of these to see how DAX functions in each. These DAX functions in Power BI will behave differently depending on where you use them.
Calculated Columns
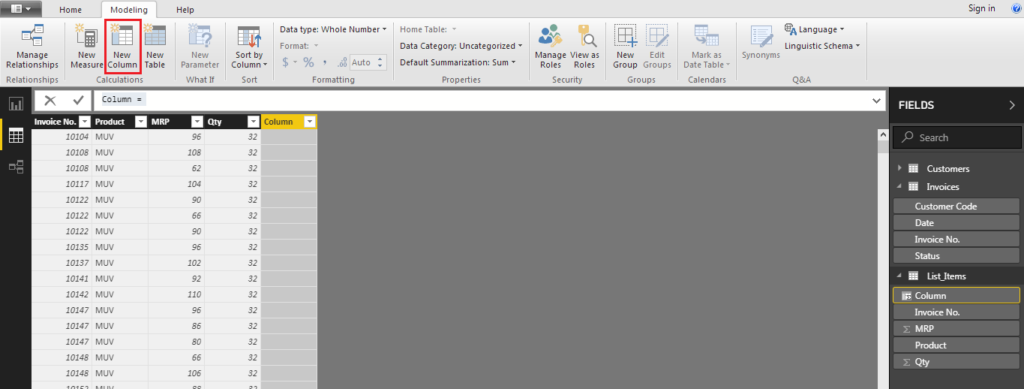
As the name may suggest, you can create new columns based on the data as needed. For example, there is no ‘net price’ column available in the List_Items table. Only MRP & quantity are available. Let’s use DAX to calculate a new column. This will demonstrate how simple it is to get started with DAX. To do this, in the data view, click on the List_Items table. Then to add a new calculated column, go to the Modeling Tab and select New Column. A new blank column will be created and your cursor will be in the DAX editor (similar to the formula bar in Excel).
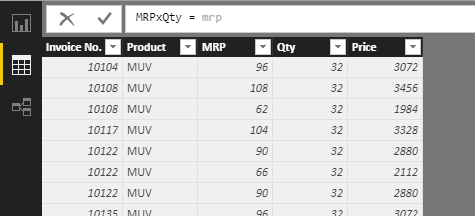
Here, whatever is before the = will become the name of the column (you can rename the column later on as well). The calculation or, more appropriately, expression will go after the equal sign. Let’s name the column ‘Price’. After the equal sign, type mrp and you should see an automatic dropdown showing the table and column name like this:
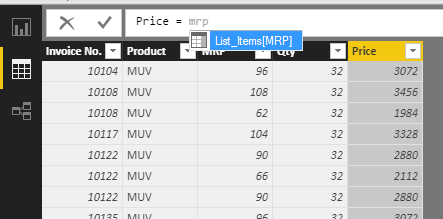
Pressing tab will type it out for you! Next, multiply by the quantity column and press enter. Once done, your ‘formula’ or expression should look like this:
Price = List_Items[MRP]*List_Items[Qty]
In the data, each row will now have the respective calculated price.
Calculated columns are easy to understand and use, but take up more storage space on disk, especially if there are more than a few billion rows of data. This is because all the rows will have to be calculated every time the data is refreshed.
Measures
Measures allow you to perform a calculation, without actually adding to the data. This is very helpful for reports; where the price can be shown, without needing a whole new column to store it in. Just one major difference is that measures have to be told exactly what to calculate on. If you type in a measure to calculate MRP * Qty; you would not get a dropdown with the column names:
This is indicating that such a calculation is not accepted at all. This is because in order to calculate, we need to first specify what needs to be calculated –
1] Total of the MRP column * Total of Qty column
OR
2] the MRP value in each row * the corresponding Qty value in each row
This difference will be easier to grasp if you try to do both these calculations on this:
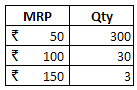
The answer to the first calculation will be ₹99,900 and the answer to the second will be ₹18,450!
Calculated columns just assumed and automatically used the second calculation. Using measures, you can calculate for each row by using:
MRPxQty = SUMX(List_Items,List_Items[MRP]*List_Items[Qty])
The ‘X’ after the sum means this calculation will be carried out for each row. This difference is officially called the Row Context.
Tables
DAX functions in tabular model simply return entire tables, not just a value or a column of values. For example, to get a list of all the cities the company has customers in, use the function:
CitiesTouched = DISTINCT(Customers[City])
This will create a table called ‘CitiesTouched’ and list out all the distinct or unique values in the City column in the Customers Table. This table can then be used independently as just like any other table. It will also be visible with the other tables in the tables section of Power BI.
A word on Filters
Filters essentially “hide” any rows that do not fit a given criteria. An calculations after filtering out data will be applied only on rows that match the criteria. This is similar to what happens in Excel with the subtotal or aggregate functions. By default, they ignore any data that is filtered out. In DAX, most functions by default ignore rows that are filtered out. This is officially called the Filter Context. There are a few exceptions that can operate outside of the filtered data (see the calculate & all functions below).
Power BI DAX Functions
Some related function in DAX are as follows. Since a lot of them are available in Excel, they function just like you would expect them to. Will elaborate more where necessary. Like in Excel, the required syntax/arguments/ format function in DAX will be displayed in the application itself.
Average
Find the average from a given set of values.
Example – find out the average sales amount across all orders.
AvgSales = AVERAGE(List_Items[Price])
Max
Find the maximum from a given set of values.
Example – Find out the highest order.
HighestSale = MAX(List_Items[Price])
Min
Find the minimum from a given set of values.
Example – Find out the lowest order.
LowestSale = MIN(List_Items[Price])
Count
Count any numerical data.
Example – Count number of invoices generated.
InvoiceVolume = COUNT(Invoices[Invoice No.])
CountRows
Count the number of rows.
Example – Count the number of rows in the ‘CitiesTouched’ table.
RowsOfCitiesTouched = COUNTROWS(CitiesTouched)
CountA
Count any kind of data; except blanks.
Example – Count the customer codes to get the number of customers the company has catered to.
CustCount = COUNTA(Customers[Customer Code])
Concatenate
Is used to join values in calculated columns. Use ConcatenateX if using in measures.
Example – Concatenate the Product names and MRPs will give a unique code for all the price points at which each product is sold. This is helpful because the price of the product determines variant in our specific data model.
ProMrp = CONCATENATE(List_Items[Product],List_Items[MRP])
TotalYTD
Calculates the sum from the start of current Year To a given Date. It uses calendar year, not financial year. Calculates for each row, i.e. will return single values.
Example – Calculate running / cumulative totals for the price column.
CumiSales = TOTALYTD(SUM(List_Items[Price]),Invoices[Date])
Distinct
Returns unique values as a table. Using this in a calculated column will not work as it returns a whole table.
Example – As used above, in the tables section.
Filter
The DAX filter function returns a Table based on a criteria. Can be used to create a Sub- Table. Using this in a calculated column will not work as it returns a whole table.
Example – Create a new table showing customers only from the USA.
CustUSA = FILTER(Customers,Customers[Country]="USA")
Calculate
The Calculate function in DAX is used to circumvent all existing filters applied to any table and calculate. It can also add new filters before calculating.
Example – Create a new table showing total sales for each product. Filter the data to show only sales from a single country (marked red). Add a new column to show percentage of that country’s sales vis a vis total sales.
PercentOFGlobal = SUM(List_Items[Price]) / CALCULATE(SUM(List_Items[Price]),ALL(List_Items[Product]),ALL(Customers[Country]))
All
Returns everything. Ignores filters.
Example – Used with the calculate function above.
You can download the Power BI file with all the functions here to play around with and study. Get the file here.
This DAX tutorial is a good starting point on your way to learning its many uses. With some more practice and a lot more learning data analytics techniques using Excel & Power BI, DAX can become an indispensable tool to analyse analyzed the businesses behind it.