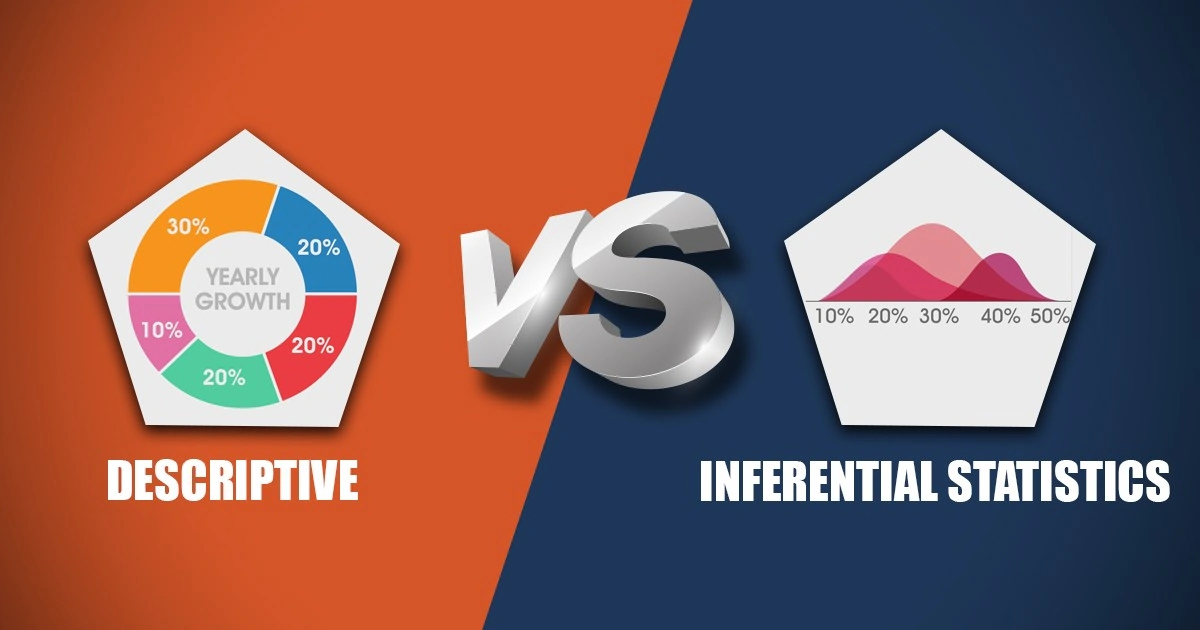
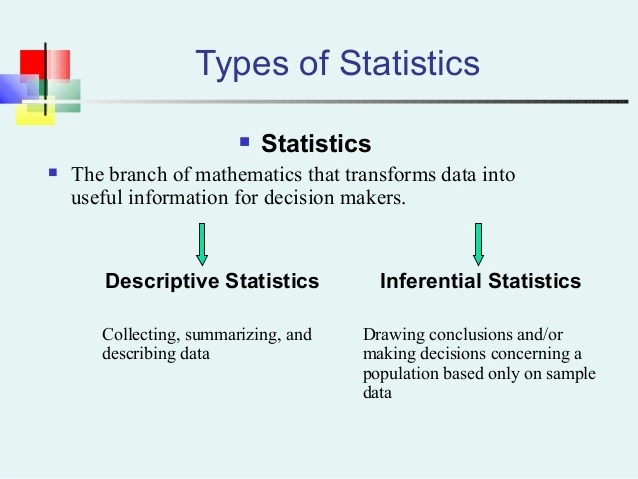
Greg Easterbrook once said, “Torture numbers, and they will confess to anything.” However, there is a lot of debate on the methodology of this torture. Descriptive vs inferential statistics is one such age-old debate. Statistics as a field of study can be divided into two main branches, descriptive and inferential statistics.
Today, in most research conducted on groups of people, both descriptive and inferential methods are used. Hence, the debate of descriptive vs inferential statistics seems redundant to many. While some of the statistical measures are similar in both, the methodologies and goals are very different. In this article, we discuss inferential vs descriptive statistics with examples and discuss the differences between the two.
Descriptive Statistics Definition
The simple
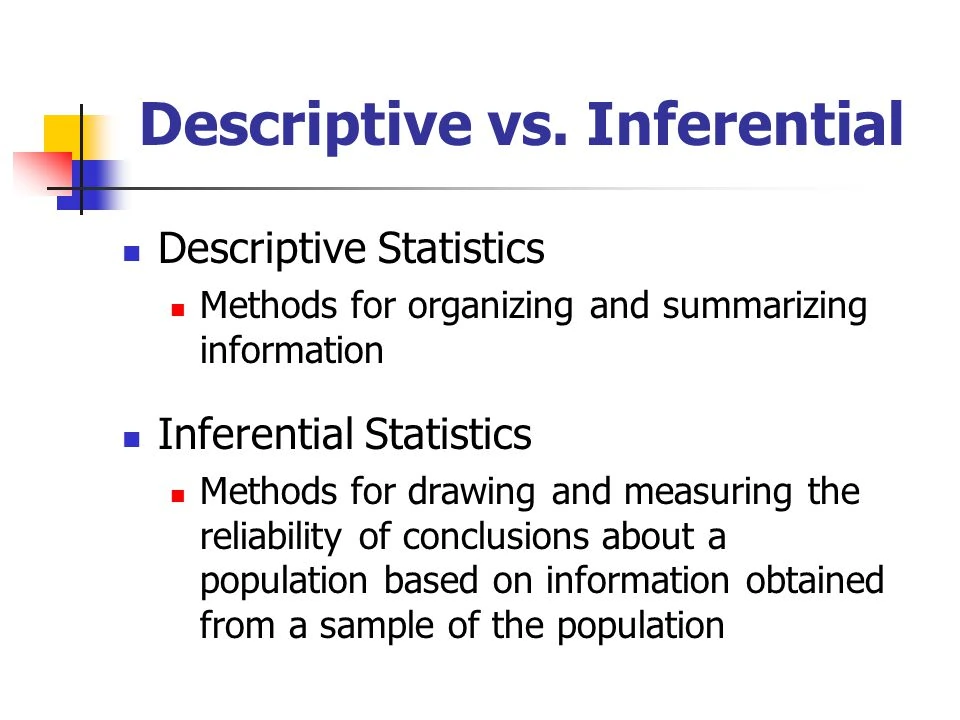
definition is statistics that describe the data in some way. Descriptive statistics is the term given to the analysis of data that helps to summarize or show data in a meaningful manner. Descriptive statistics allows for important patterns to emerge from this data.
Descriptive statistics is key because it allows us to present large amounts of raw data in a meaningful way. This enables a better interpretation of data. There are usually two types of descriptive statistics:
(i) Measures Of Spread
Measures of spread describe how spread out the distribution is for a particular group of data. Measures of spread give an idea of the range and variation in a given set of data. This helps develop a better understanding of the nature of the data. Measures of spread include things like variance, standard deviation, range, and quartiles.
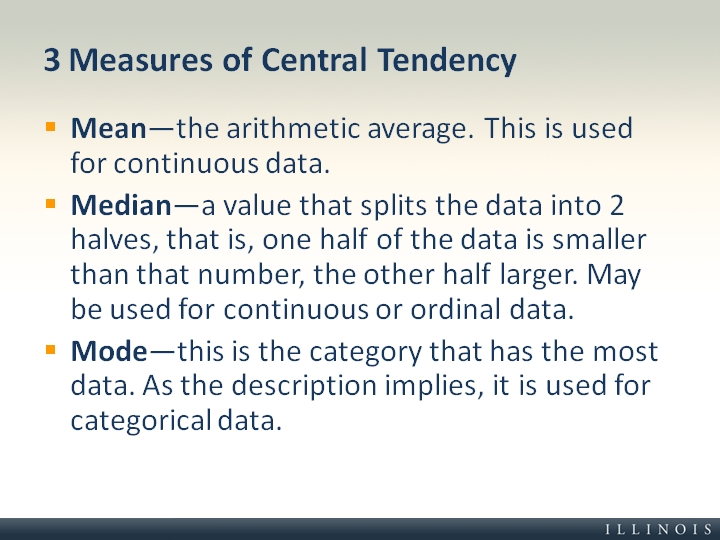
(ii) Measures Of Central Tendency
These are statistical measures that describe the central position of a frequency distribution for a large amount of raw data. These measures include many different statistics such as mean, mode and median. Different measures of central tendency are more appropriate to use under different conditions.
Inferential Statistics Definition
To understand the inferential statistics definition, we need to first understand what the term population means in statistics. Population refers to the entire raw data that you are interested in and need to analyse. Descriptive statistics, for instance, are applied to the entire population data.
However, you may need to analyse some data which may not be available in entirety. For instance, you may need some raw data on all 18-year-olds in the world and you simply don’t have the entire population data. This is where you use sample data. The sample data represents only a portion of the population.
Inferential statistics are statistical techniques that allow us to use the samples to make generalizations about the population data. A process called sampling is used to make sure the sample chosen represents the population as closely as possible. Inferential statistics are used extensively in data science.
Inferential statistics are used because samples cannot represent the population with complete accuracy and analysis on sample data is therefore prone to “sampling error”. Inferential statistics uses two methods. These include:
(a) The estimation of the parameters (which are standard parameters like mean, mode, variance, etc.) and
(b) The testing of the statistical hypothesis
Descriptive Statistics Examples
Here’s an example that will help clarify the descriptive statistics definition. Say there is a shop by the beach that sells two items- coconuts and watermelons. In the first week of December, the shop owner sells 6 coconuts and 4 watermelons. One descriptive statistic would be that 40% of the items sold were watermelons.
Say, you find out that the shop sells 6 watermelons in the second, 8 in the third, and 12 in the fourth. Another descriptive statistic would be that the mean or average weekly sale of watermelons in December was 7.5.
Similarly, you can use descriptive statistics to answer a number of questions about this shop. Such as “How much is the seasonal variation in its sales?”, “How far apart are the best and worst month in terms of sales?” , “How many of the monthly sales figures are the same?” and so on. These answers can be found in a variety of descriptive statistics like mode, median, mean, variance, standard deviation and so on.
Descriptive statistics are also used to represent data graphically. Histograms, pie charts, bar graphs, and so on are nothing but a visual way of representing the data. This helps put it in the form that allows for analysis and interpretation. For instance, a bar graph can be used to represent the monthly sales of the shop for watermelons and coconuts. It can show which item performs better and how these items perform over the months. Descriptive vs inferential statistics is an age-old debate because while descriptive statistics gives more accurate results, inferential statistics can be applied to larger datasets.
Inferential Statistics Examples
Here are some examples that will help clarify the inferential statistics definition. Say you have been asked by the Election Commission to find out if Indian voters are satisfied with voting procedures for Lok Sabha elections.
Of course, it’s impossible to question every single voter. So you would simply have to make do with a sample of Indian voters. For the results from the sample to reflect the total population closely, you have to choose the sample very carefully. And that is what inferential statistics is all about.
For instance, you need to make sure no particular category of citizens is over-represented, whether its a particular class, caste, or community. There are some principles used in inferential statistics to make this possible.
One of them is random sampling, which means that every item in the population data should have an equal chance of being selected in the sample. And that the selection of one item shouldn’t affect the selection of another.
Another principle is the size of the sample. The size of the sample has to be large enough for there to be no unintentional skewing. This can sometimes happen when the sample data is very small. Only a large sample size makes it possible for the sample size to be as representative of the population as possible.
This video gives us a detailed understanding of descriptive and inferential statistics, descriptive vs inferential statistics, and which is better and why.
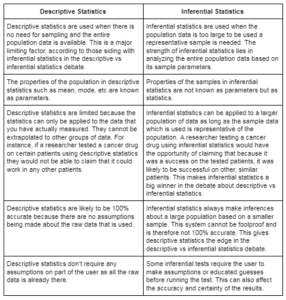
Inferential vs Descriptive Statistics: Differences
Inferential vs Descriptive Statistics: Which Is Better?
There is no easy answer to this question. Both descriptive and inferential statistics signal very different approaches to understanding data. One method is not superior to the other in absolute terms. In fact, the superiority of the method depends on the circumstances.
For instance, where the population data is limited, descriptive statistics is the right approach because it guarantees accuracy. However, when solving complex problems that affect a huge population, this method won’t work. Using inferential statistics to extrapolate the results for a larger population is the way to go in this case.
So both methods have their limitations and advantages. The superiority of the method depends purely on the nature of the research and the problem that is being solved.
Conclusion
The debate about descriptive vs inferential statistics takes away from crafting a more holistic approach. While descriptive statistics are used to present raw data in an accurate way, inferential statistics are used to apply inferences derived from a data sample to the larger data population.
Both methods are equally critical to research and advancements across scientific fields, particularly data science. Therefore, it is important for scientists, researchers, and statisticians to recognize that both have their advantages and limitations and choice of method should depend on the circumstances. Strictly choosing one over the other in the descriptive vs inferential statistics debate is a waste of time.
If you are also looking forward to starting a career in Data Science, join our Data Science Master Course.


Excellent guide! I specially liked how you emphasized on the importance of quality and efforts invested , Very pedagogic and comprehensive. Two thumbs up! I thoroughly enjoyed reading your blog and learned a lot!!!! Thanks a lot for investing time and sharing your experience. You Nailed It